Facebook is a huge ecosystem and every brand can use it in many ways to promote its offerings. There are Facebook Pages, groups, ads, and many other formats. One usually can’t use them all, not to mention tracking the effectiveness of all those efforts.
Tracking various ad metrics is crucial for optimizing performance and maximizing ROI in facebook ad campaigns. Facebook video analytics, which include tracking engagement metrics such as reactions, shares, and comments on videos, are essential for enhancing video performance and creating content that resonates better with the audience.
Nevertheless, if you’re a person responsible for your brand’s Facebook presence, you should be the one to define how your company’s social media success will be measured. Facebook video metrics, such as average time spent watching a video and three-second video views, serve as key performance indicators for video content. That all leads to choosing key Facebook metrics that you’ll be monitoring on a daily, or monthly, basis.
Let’s talk about a few of them. We don’t want you to become overwhelmed, that’s why we’ll focus on seven indicators that we find crucial.
Understanding Facebook Metrics
In the ever-evolving landscape of social media, understanding Facebook metrics is more crucial than ever. Utilizing Google Analytics to track and measure website traffic derived from social media, particularly Facebook, can provide detailed insights into user interactions with links shared on these platforms. These metrics are the backbone of any successful Facebook marketing strategy, providing invaluable insights into how your content is performing and how your audience is engaging with it. By keeping a close eye on these important Facebook metrics, you can make informed decisions that drive growth, foster stronger connections with your audience, and optimize your overall marketing strategy.
Why Track Facebook Metrics?
Tracking Facebook metrics isn’t just about numbers; it’s about understanding the story behind those numbers. By analyzing these metrics, businesses can gain a deeper understanding of their audience’s behavior, preferences, and engagement patterns. This, in turn, allows for more targeted and effective marketing efforts. Whether it’s tweaking your content to better resonate with your audience or adjusting your ad spend to maximize ROI, Facebook metrics provide the data-driven insights needed to make these decisions. In essence, these metrics are the key to unlocking the full potential of your Facebook marketing strategy.
8 Facebook metrics you should track in 2025
Reach
Hello, 2025, a year in which marketers would rather not report the all-time declining reach. 😉
Unfortunately, we can’t change reality, and even though the organic reach is not satisfying for many of us, reach is usually a metric that marketers simply have to report. Facebook ad metrics are essential KPIs for assessing the effectiveness of advertising campaigns on Facebook.
Organic reach is one thing, but there are also other types of reach – paid reach and viral reach. Would you like to increase the total reach on your Facebook Page? You can obviously start investing in Facebook Ads. And honestly, that’s what Facebook is pushing all brands and marketers to do.
How to measure reach using Facebook Insights?
There are several places in which you can find your reach metric. Usually, marketers are choosing either Facebook Insights or one of the external social media analytics apps.
If you decide to head over to one of the social media analytics tools, for example, Sotrender, checking your reach will be pretty easy, as you’ll get this number almost automatically after connecting your profile to the app.

Measuring Facebook reach in Sotrender
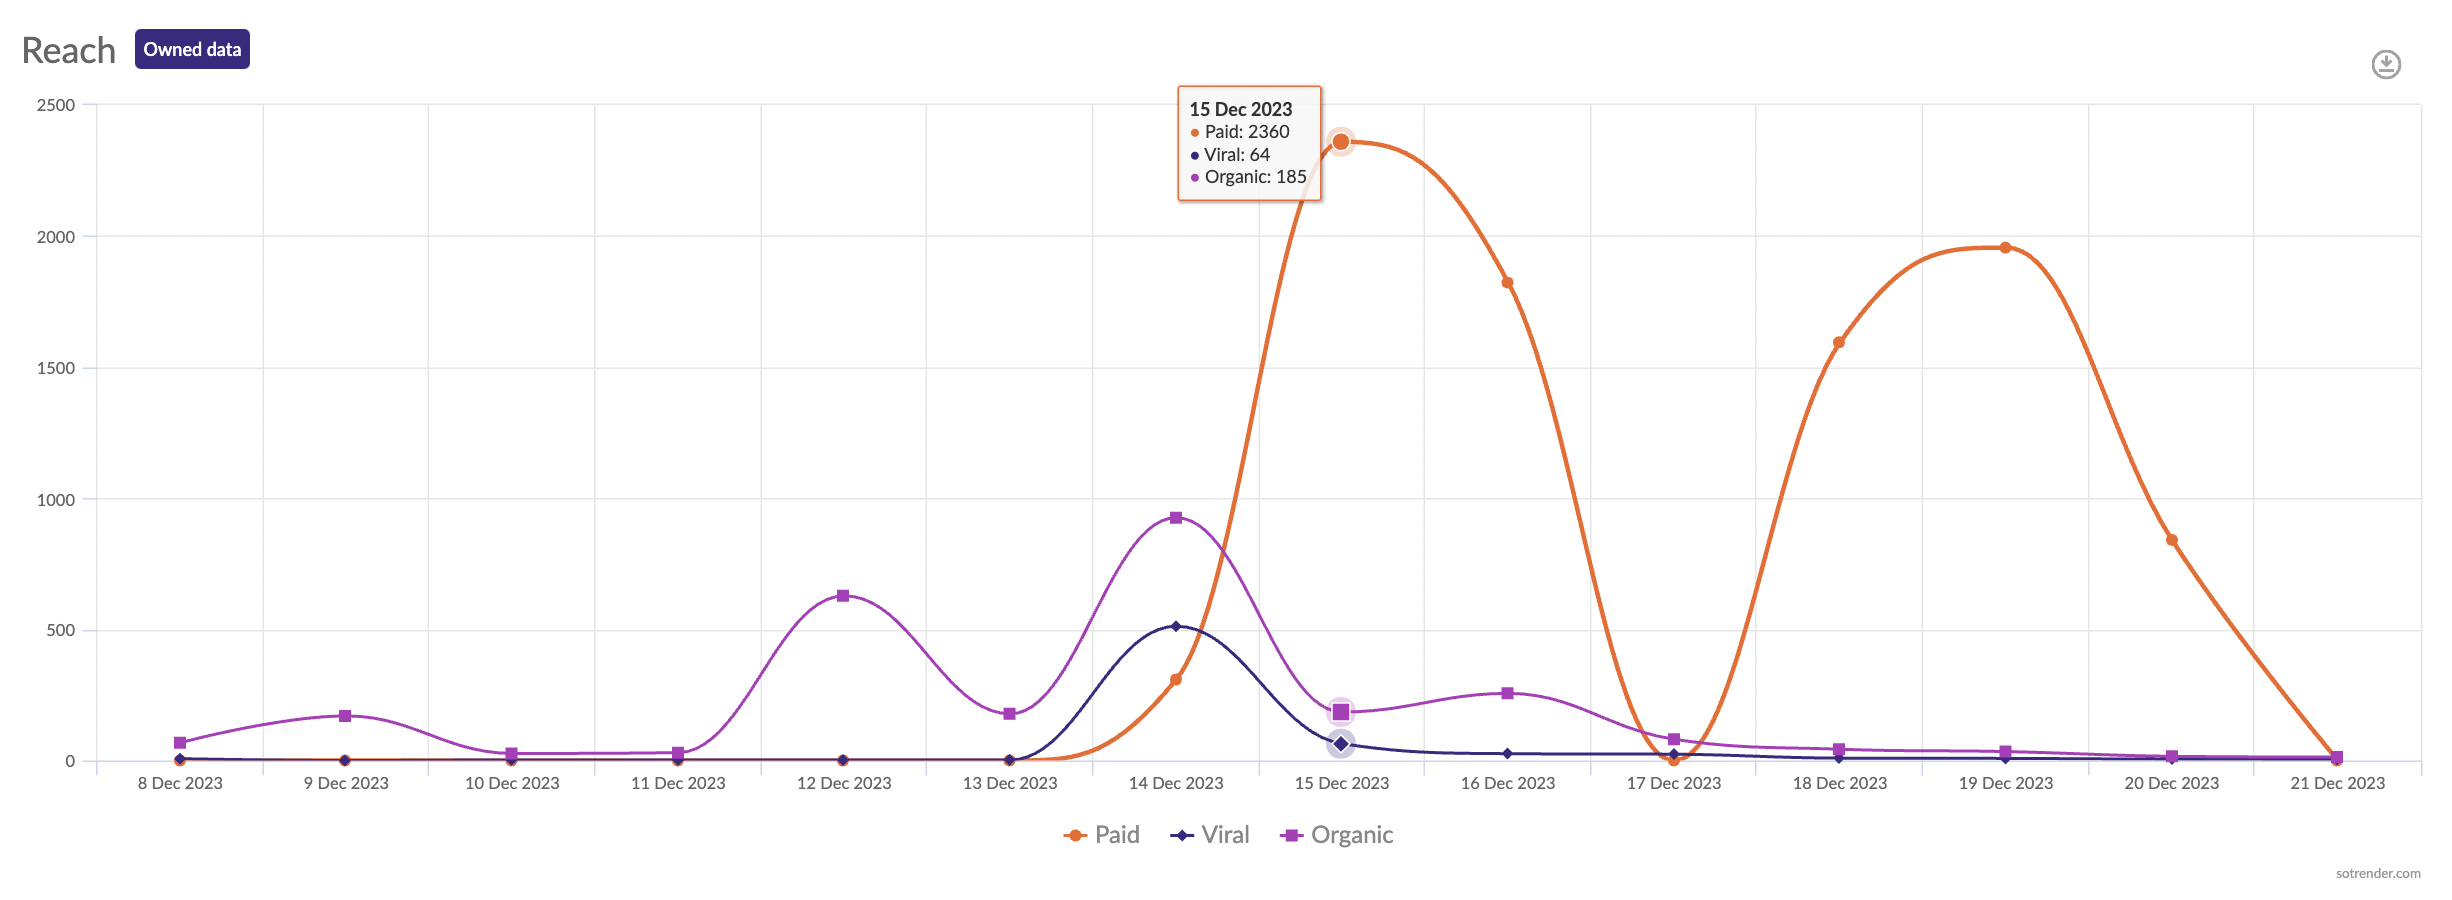
Apart from checking your total reach, you can also monitor paid, viral and organic reach day by day. This is pretty useful especially if you need to analyze specific campaigns.

Monitoring reach day by day
Measure your reach in Sotrender >>>
Impressions
Another metric, which is similar to reach, but not the same, is impressions. What is the difference between them?
By analyzing the number of impressions, you’ll learn how many times, in total, the content on your profile (or each of your posts) was seen. This is particularly important for a Facebook post, as it helps measure performance and engagement by showing how often your content reaches your audience.
Example:
If Mary opens one post three times, each time will be counted in the total number of impressions. At the same time, in the total reach number, Mary will be counted only once, as the metric counts unique users only. That’s why, in the same time period, the number of impressions is usually higher than reach.
How to measure impressions?
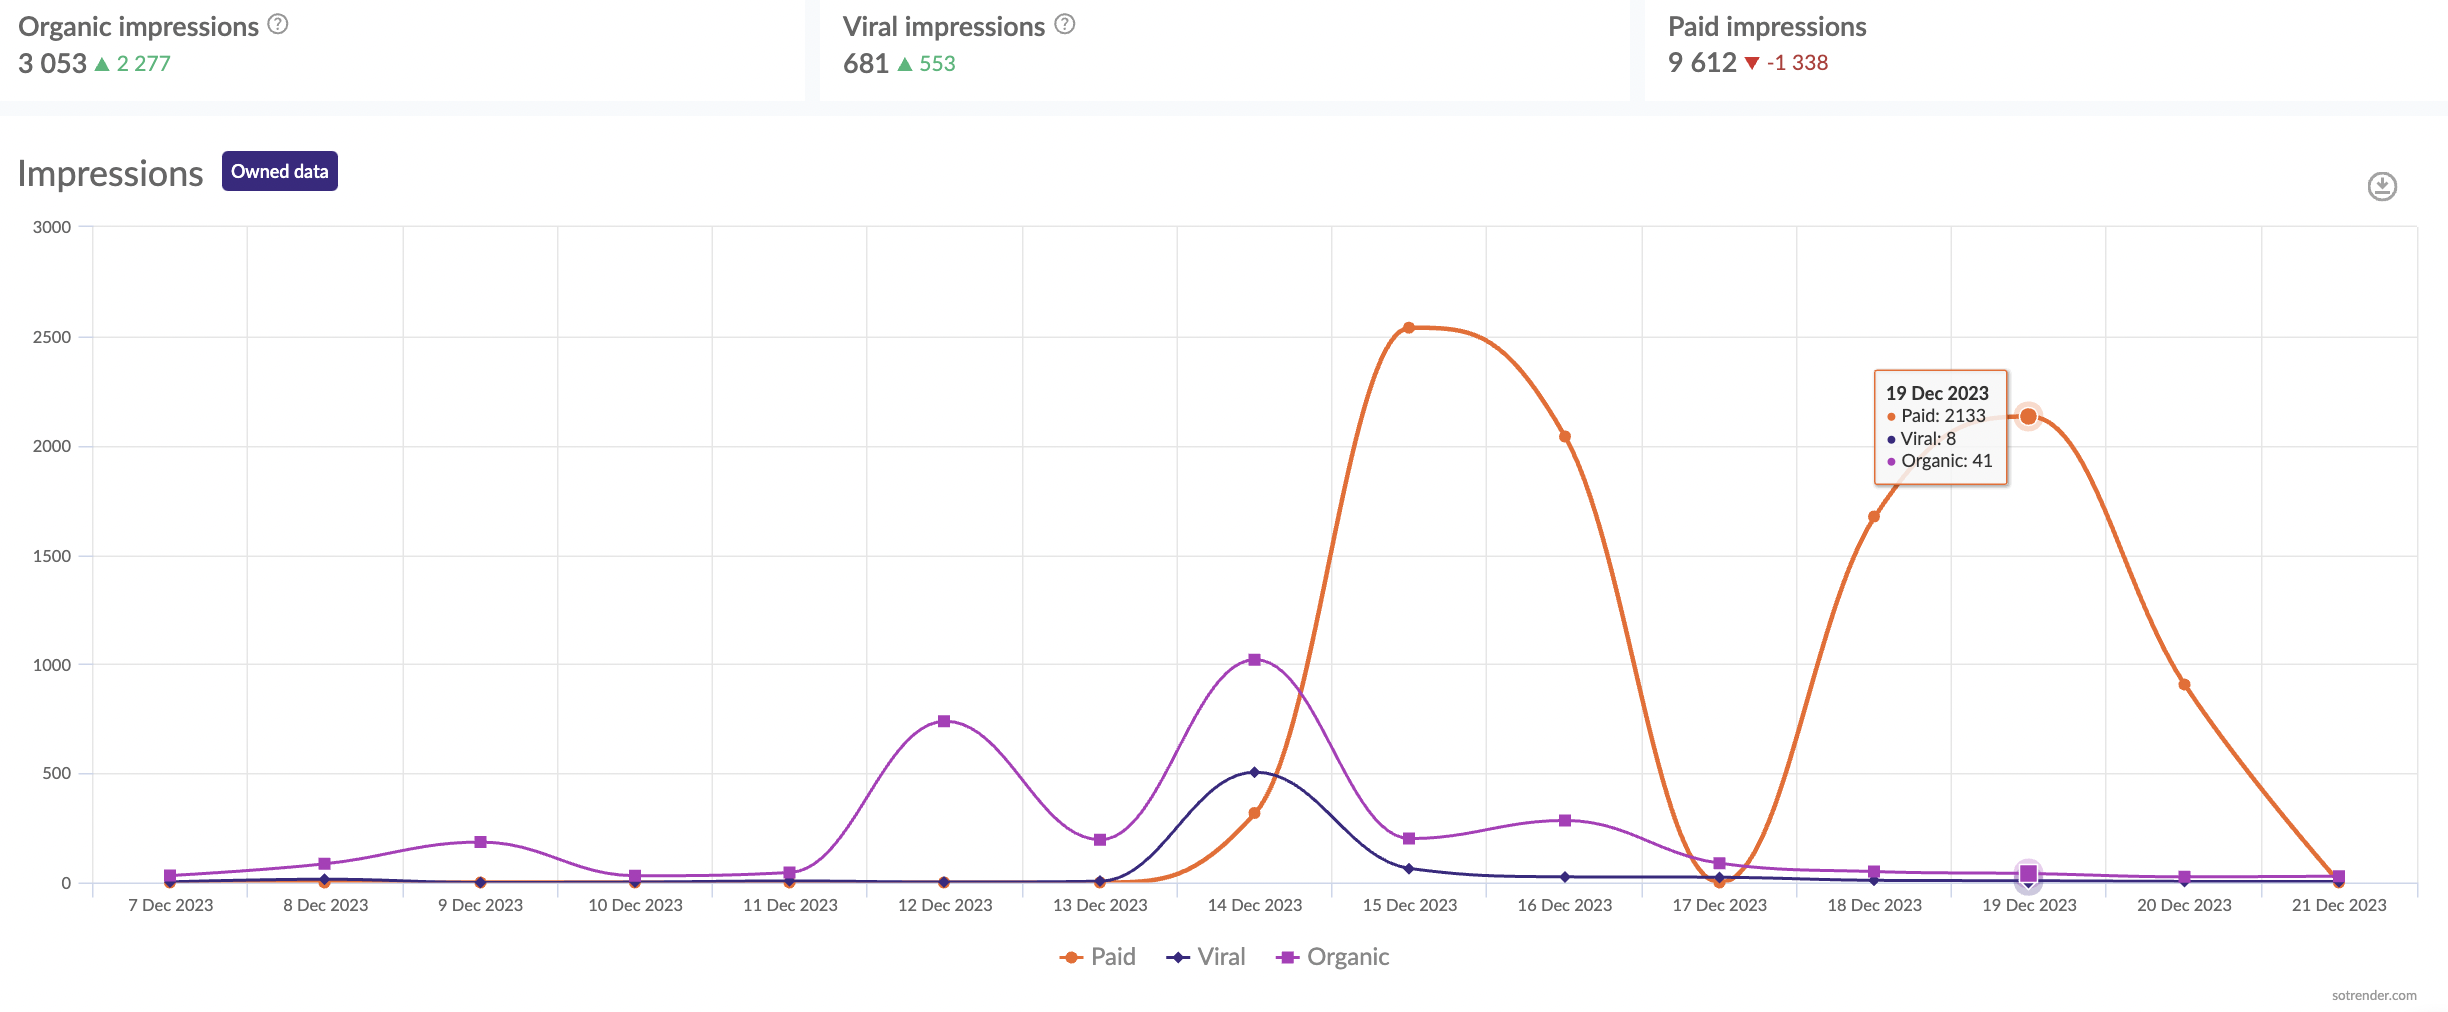
In social media analytics apps, impressions, exactly as reach, can be monitored both for your organic posts as well as for ads. What is more, when analyzing your organic performance in Sotrender, you can also analyze viral impressions.

Monitoring the number of impressions in Sotrender
Check the number of impressions >>>
Side note:
Reach and impressions, as insights metrics, can be analyzed only for the profiles that you have access to. In general, it is possible, though, to analyze quite a few metrics for competitors’ profiles, too, however, reach and impressions are not one of them.
Reach demographics
Audience demographics is a type of data that we all know, and it’s important because it informs who your Facebook fans actually are. At the same time, reach demographics isn’t something that all marketers are aware of. And it’s an even more important piece of data.
Understanding and tracking the demographics and growth of Facebook users can help tailor content effectively to meet their needs.
Reach demographics, as you most probably can guess, tells who you managed to reach with your communication. It’s important because your follower base may not be changing that dynamically, but at the same time, you may be reaching more and more new users with completely different demographics.
If you’re reaching slightly different users than you thought you were, here is what you can do:
- Revise your communication strategy and targeting and adjust them so that they better correspond with your ideal target audience.
- Use your new audience as a reason to expand your business. Alter your products or create new ones that will be a nod towards them.
Engagement
Engagement is not the easiest Facebook metric to track as nowadays users may engage with your content and Facebook Page in many ways. At the same time, engagement is what marketers should fight for, as it can have a huge impact on the overall marketing and sales success of your company.
Facebook engagement metrics are crucial measurements of user interactions with a Facebook page, including reactions, shares, and comments. Additionally, assessing engagement and performance metrics for Facebook videos by tracking video views, reactions, shares, and comments is essential to evaluate the effectiveness of video marketing strategies.
How can you easily measure your Facebook engagement metrics?
There are many ways of measuring and tracking engagement. Let’s focus today on one metric that you most probably haven’t heard about.
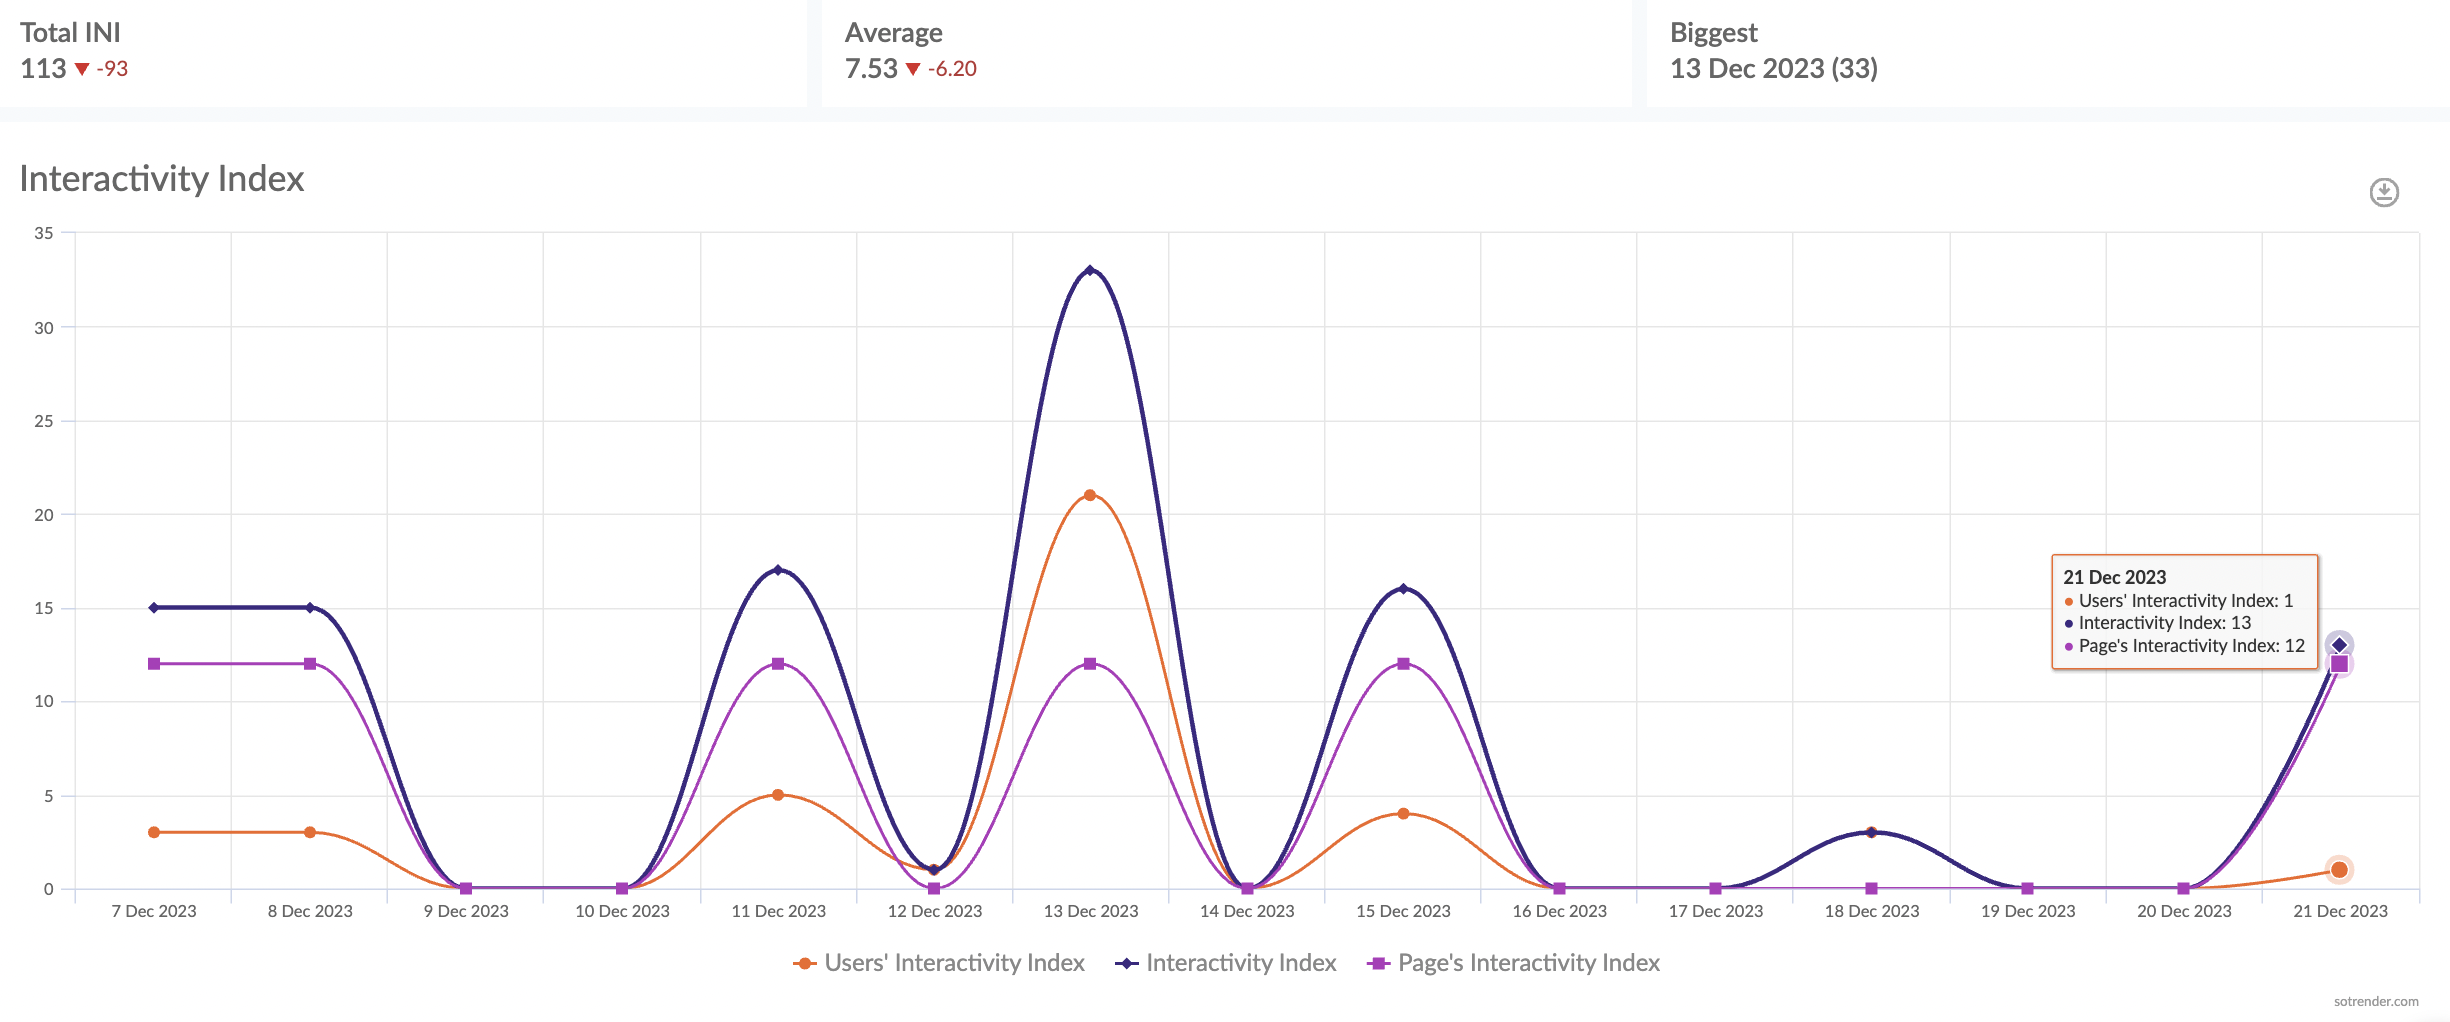
At Sotrender, we’ve formulated a special metric called Interactivity Index (INI), which measures the total engagement on a specific profile.
What is important is that when calculating InI, we assign different weights to different types of user activity:
- Like (or other reaction) = 1
- Comment = 4
- Post (text, status, multimedia, etc) = 12
- Share = 16
Some activities are basically more valuable than others. For example, a share means that the user was highly engaged with the content he saw, that’s why shares have a much higher weight when calculating INI.

Use the Interactivity Index metric to measure your Facebook engagement
Check your Interactivity Index >>>
Pro tip:
By using Sotrender’s Interactivity Index, you can monitor not only the engagement on your own profile but also on competitors’ profiles. With the Relative Interactivity Index, you can precisely compare engagement on various profiles.
Facebook Page Insights
Understanding the importance of Facebook Page Insights
Facebook Page Insights is a powerful tool that provides valuable information about your Facebook page’s performance. It helps you understand your audience, track engagement, and make data-driven decisions to improve your Facebook marketing strategy. With Facebook Page Insights, you can gain a deeper understanding of your page’s reach, engagement, and audience demographics, which can help you refine your content strategy and optimize your Facebook ads.
Facebook Page Insights provides a wealth of information, including:
- Page views and unique visitors
- Engagement metrics, such as likes, comments, and shares
- Audience demographics, including age, gender, and location
- Top-performing content and posts
- Follower growth and retention rates
By analyzing these metrics, you can identify areas of improvement, track the success of your content and ad campaigns, and make informed decisions to optimize your Facebook marketing strategy. For instance, if you notice a spike in page views but low engagement, it might be time to revisit your content strategy. Similarly, understanding the demographics of your audience can help tailor your posts to better resonate with them, ultimately driving higher engagement and conversions.
Facebook Post Performance
Evaluating the success of your Facebook posts
Evaluating the success of your Facebook posts is crucial to understanding what works and what doesn’t in your content strategy. Facebook provides several metrics to help you measure the performance of your posts, including:
- Reach: The number of unique users who viewed your post
- Impressions: The number of times your post was viewed
- Engagement: The number of likes, comments, and shares on your post
- Engagement rate: The percentage of users who engaged with your post
- Click-through rate (CTR): The percentage of users who clicked on a link in your post
By analyzing these metrics, you can identify which types of content perform well, which audiences engage with your content, and which posts drive the most traffic to your website. This information can help you refine your content strategy, optimize your Facebook ads, and improve your overall Facebook marketing performance. For example, if a particular type of post consistently receives high engagement, you might consider creating more content in that style. Conversely, if certain posts have low CTR, it may be worth revisiting the call-to-action or the content itself to make it more compelling.
Facebook ad metrics: CPC & CPM
Let’s now talk a little bit about some KPIs used to measure ad performance.
Tracking various Facebook ads metrics, such as cost per click (CPC) and cost per thousand impressions (CPM), is essential for evaluating the effectiveness of advertising campaigns and adapting strategies based on comprehensive data analysis.
Cost-related metrics – like cost per mile, cost per click, cost per conversion, cost per result – are one of the most often tracked and reported metrics. It’s no wonder, as they help to understand if setting a specific campaign was worth it and how much did you spend for a specific user action.
If your campaigns are focused on lead generation, it’s also worth considering how quickly those leads are processed. You can integrate Facebook lead ads with Gmail to automatically forward new leads to your inbox or CRM, which can boost both response time and conversion potential while making your cost-per-lead metrics more meaningful.
How to measure CPC & CPM?
Analyzing your CPM or CPC is pretty easy. In theory, the lower the costs are, the better. When it comes to the raw numbers, you can find them in the Facebook Ads Manager panel.
However, it’s better to analyze CPC or CPM in a more in-depth way, for example, along with other metrics (like spend). A good practice is also comparing cost-related Facebook metrics from different campaigns to each other.
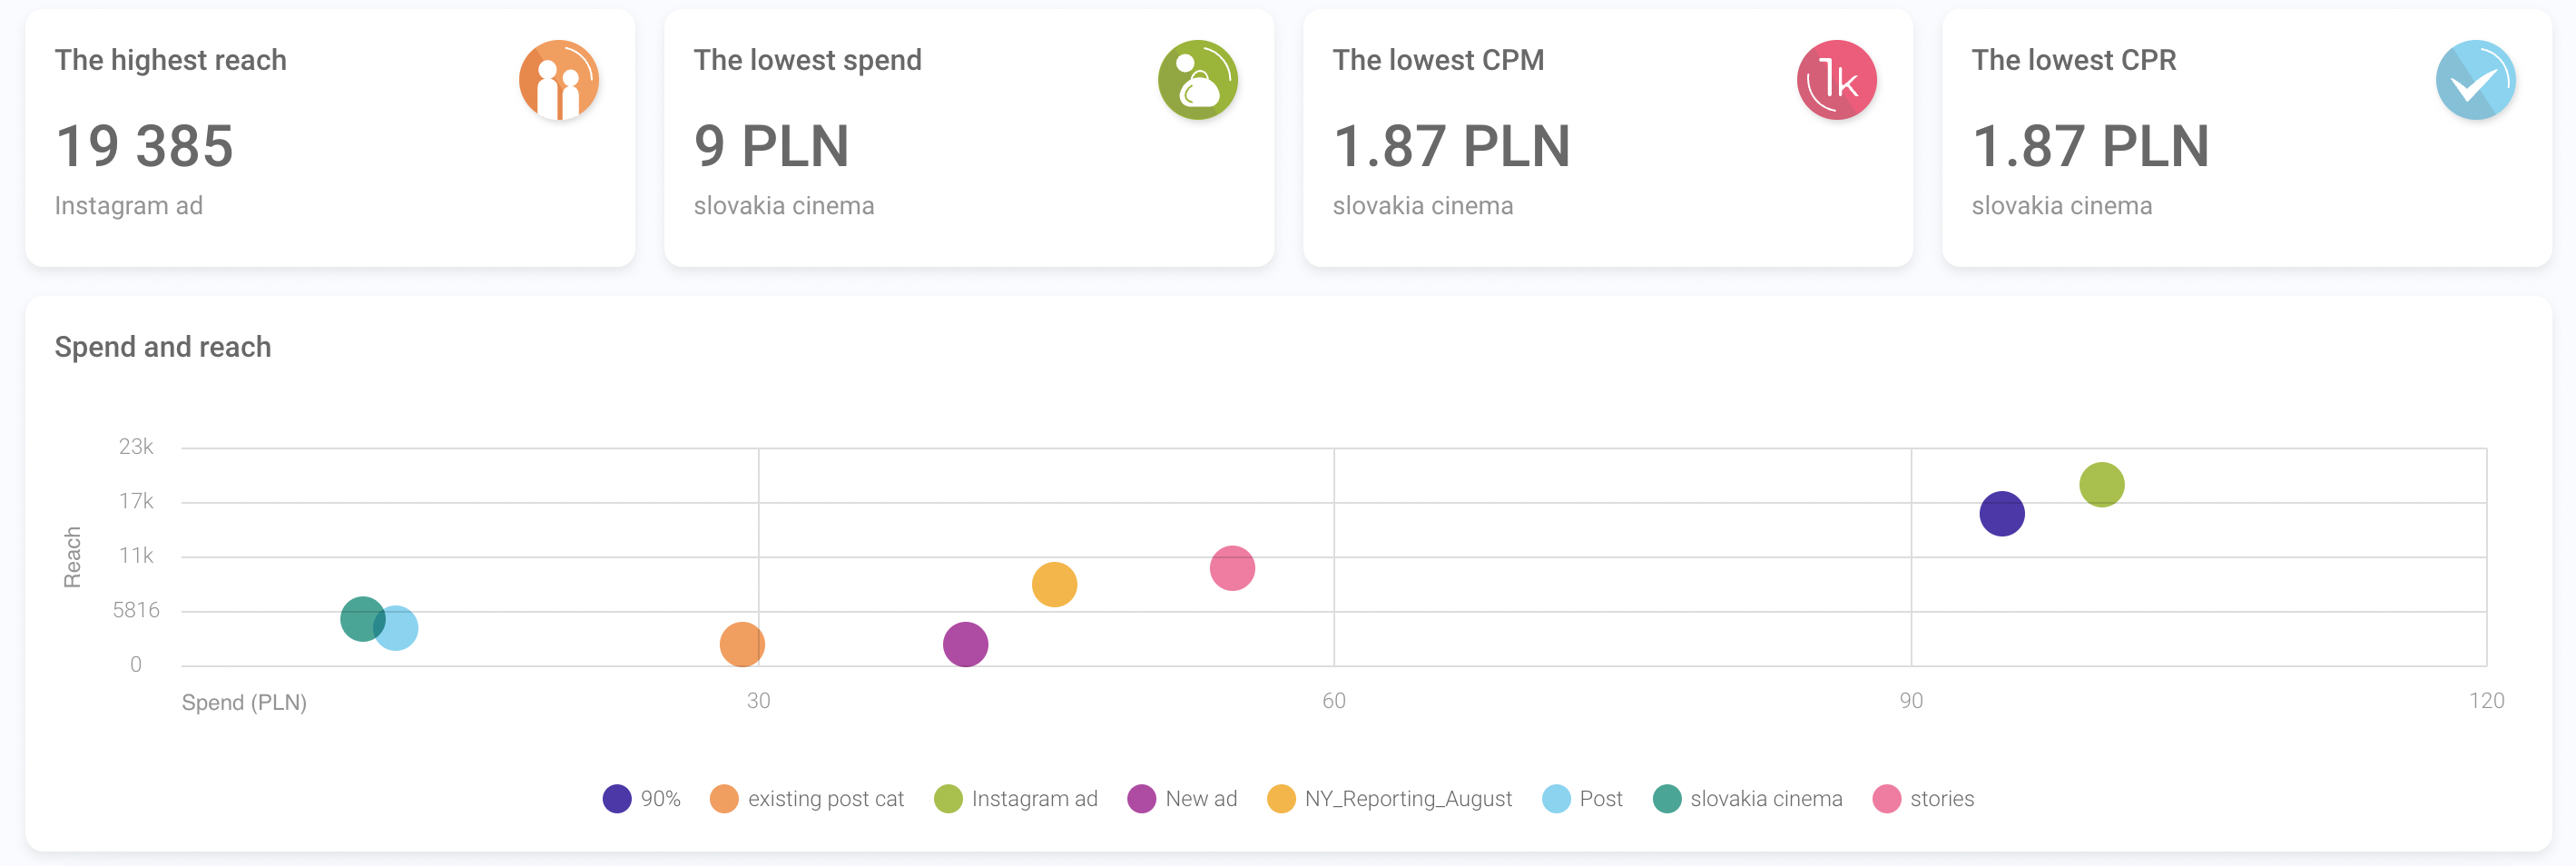
Here, Sotrender comes in handy, again. On the combo charts, you can easily track relations between metrics, such as:
- spend and reach,
- spend and link clicks,
- spend and engagement,
- spend and conversion.

Monitor cost-related metrics in Sotrender
It’s a great way to find out which campaigns were actually the most effective.
Analyze your ads performance >>>
Audience Share
Another indicator that you should be tracking in order to analyze the effectiveness of your ad campaigns is audience share. Audience share, also known as audience saturation (or Facebook audience share), is a metric informing how effective you were when it comes to reaching your ideal audience in the Meta ecosystem.
To track various Facebook metrics available for managing pages, you can use the Meta Business Suite. This platform allows you to monitor engagement, reach, impressions, and demographic insights, helping you enhance your social media strategy effectively.
Audience share is calculated by dividing the ad set reach by Facebook’s estimated reach and converting the outcome into percentages. The higher the number is, the better. 100% audience saturation would mean that the ad set reached the whole target audience estimated by Facebook.
Monitor the audience share metric >>>
Sentiment
Is high user engagement always a reason to pop the champagne? Not exactly.
Even though users can leave many comments under your posts, you should be carefully looking at what those comments are about. In the social media era, not much is needed to trigger a crisis. Additionally, it’s crucial to track Facebook video engagement by analyzing several Facebook video metrics, such as reactions, shares, and comments on videos, to ensure your content resonates with the audience and meets their expectations.
Audience Retention
Understanding and improving audience retention
Audience retention is a critical metric that measures how well your content holds the attention of your audience. Facebook provides several metrics to help you measure audience retention, including:
- Average watch time: The average amount of time users spend watching your videos
- Video retention: The percentage of users who watch your videos to the end
- Engagement retention: The percentage of users who engage with your content over time
By analyzing these metrics, you can identify areas where your content may be losing audience attention and make adjustments to improve retention. This can include:
- Creating more engaging and relevant content
- Optimizing your video content for better watch time and retention
- Using Facebook’s built-in features, such as polls and quizzes, to increase engagement
- Experimenting with different content formats and styles to find what works best for your audience
By improving audience retention, you can increase engagement, drive more traffic to your website, and ultimately, achieve your Facebook marketing goals. For instance, if you notice a drop-off in video watch time, consider making your videos more concise or adding engaging elements early on to capture viewers’ attention. Similarly, interactive features like polls can keep your audience engaged and provide valuable feedback on their preferences.
Facebook Traffic Metrics
When it comes to driving traffic to your website, Facebook can be a powerful ally. But how do you measure the effectiveness of your Facebook marketing efforts in this regard? Enter Facebook traffic metrics. These metrics help you understand how much traffic is coming to your website from your Facebook page, giving you a clear picture of how well your Facebook posts are performing in terms of driving visitors to your site.
Understanding Facebook Referral Traffic
Facebook referral traffic is a metric that measures the amount of traffic your website receives from Facebook. This can include visitors who click on links in your Facebook posts, profile, or shared posts. By tracking Facebook referral traffic, you can gain insights into which types of content are most effective at driving visitors to your website. This information is invaluable for optimizing your marketing strategy, as it allows you to focus on the types of content that are most likely to drive conversions and achieve your business goals.
Turning Facebook Metrics into Insights
Having a wealth of data at your fingertips is one thing, but turning that data into actionable insights is where the real magic happens. Facebook Insights is a powerful tool that provides detailed information about your Facebook page’s performance, including engagement, reach, impressions, and more. By analyzing this data, you can gain a deeper understanding of your audience and make informed decisions to improve your overall marketing performance.
Analyzing Facebook Insights
Facebook Insights offers a treasure trove of information about your Facebook page’s performance. From engagement metrics to reach and impressions, this tool provides a comprehensive overview of how your content is performing. By diving into Facebook metrics, you can uncover valuable information about your audience’s demographics, interests, and behaviors. This data can be used to refine your content strategies, optimize your ad spend, and identify areas for improvement. For instance, if you notice that certain types of posts consistently receive low engagement, you can adjust your content strategy accordingly. Similarly, if your ads are underperforming, you can use the insights provided to tweak your targeting and improve your results. In short, Facebook Insights is an essential tool for any business looking to make data-driven decisions and optimize their Facebook marketing strategy.
Which important Facebook metrics should you be tracking?
The metrics we have gathered here are the ones that marketers are analyzing and paying attention to the most often. However, which ones you’ll be monitoring should be your informed decision. After all, what Facebook metrics you choose should correspond with both types of campaigns you’re running, as well as your marketing goals. It is crucial to focus on the most important Facebook metrics to ensure that your selected metrics align with specific campaign goals and drive a data-driven marketing strategy. For some companies, Facebook KPIs will be mostly related to reach and engagement, but for others, those could be related to conversions or sales.


