Once you decide to run an Instagram profile, one of the key aspects will be the content you publish. It has to be well thought out and planned, but that won’t guarantee you success.
What is equally important is your audience, and more precisely, their reactions to your content.
Let’s see then what are the best ways of checking your Instagram post analytics, as well as your audience preferences.
Why should you even care about your Instagram post analytics?
Analyzing your content performance, including posts, stories, reels, and other formats, will help you understand:
- if the strategy that you crafted is right,
- if your posts resonate with your audience interests and expectations,
- which of your content is most liked by your audience,
- what type of content you should keep on publishing,
- which posts you can definitely give up on in your communication.
Ultimately, this is your content that will be attracting new users to your profile, so it should be relevant to who your target audience is.
How to see my Instagram post analytics on Instagram
Obviously, you can analyze your posts on Instagram directly.
However, in order to get access to more data than just the number of likes and comments under your posts, you’ll have to convert your personal profile to a business profile. By doing so, you’ll get access to Instagram Insights which offers more performance stats.
By using Instagram Insights you can analyze your posts with regard to the post type (photo, video, carousel) from the last 2 years only. Luckily, it’s now much easier to analyze posts from a given period of time (some time ago only predefined time periods were available e.g. last 30 days, 90 days, or 7 days).
Another drawback of using Instagram Insights is that it is available from your mobile device only. Even though that gives you an opportunity to check your data on the go, the reality is that you do the majority of your work from 9 am to 5 pm when sitting behind your desk… To some extent, however, you can access your insights from a desktop, and here is how you can do it.
A more effective way of checking your Instagram post performance
Even though you may be looking at your Instagram post analytics for free on Instagram, there must be a reason why thousands of marketers worldwide are using social media analytics apps on a daily basis.
It’s how the data is presented and how easily accessible it is, which makes people choose third-party tools.
Sotrender, which is one such tool, facilitates the process of tracking your key Instagram metrics.
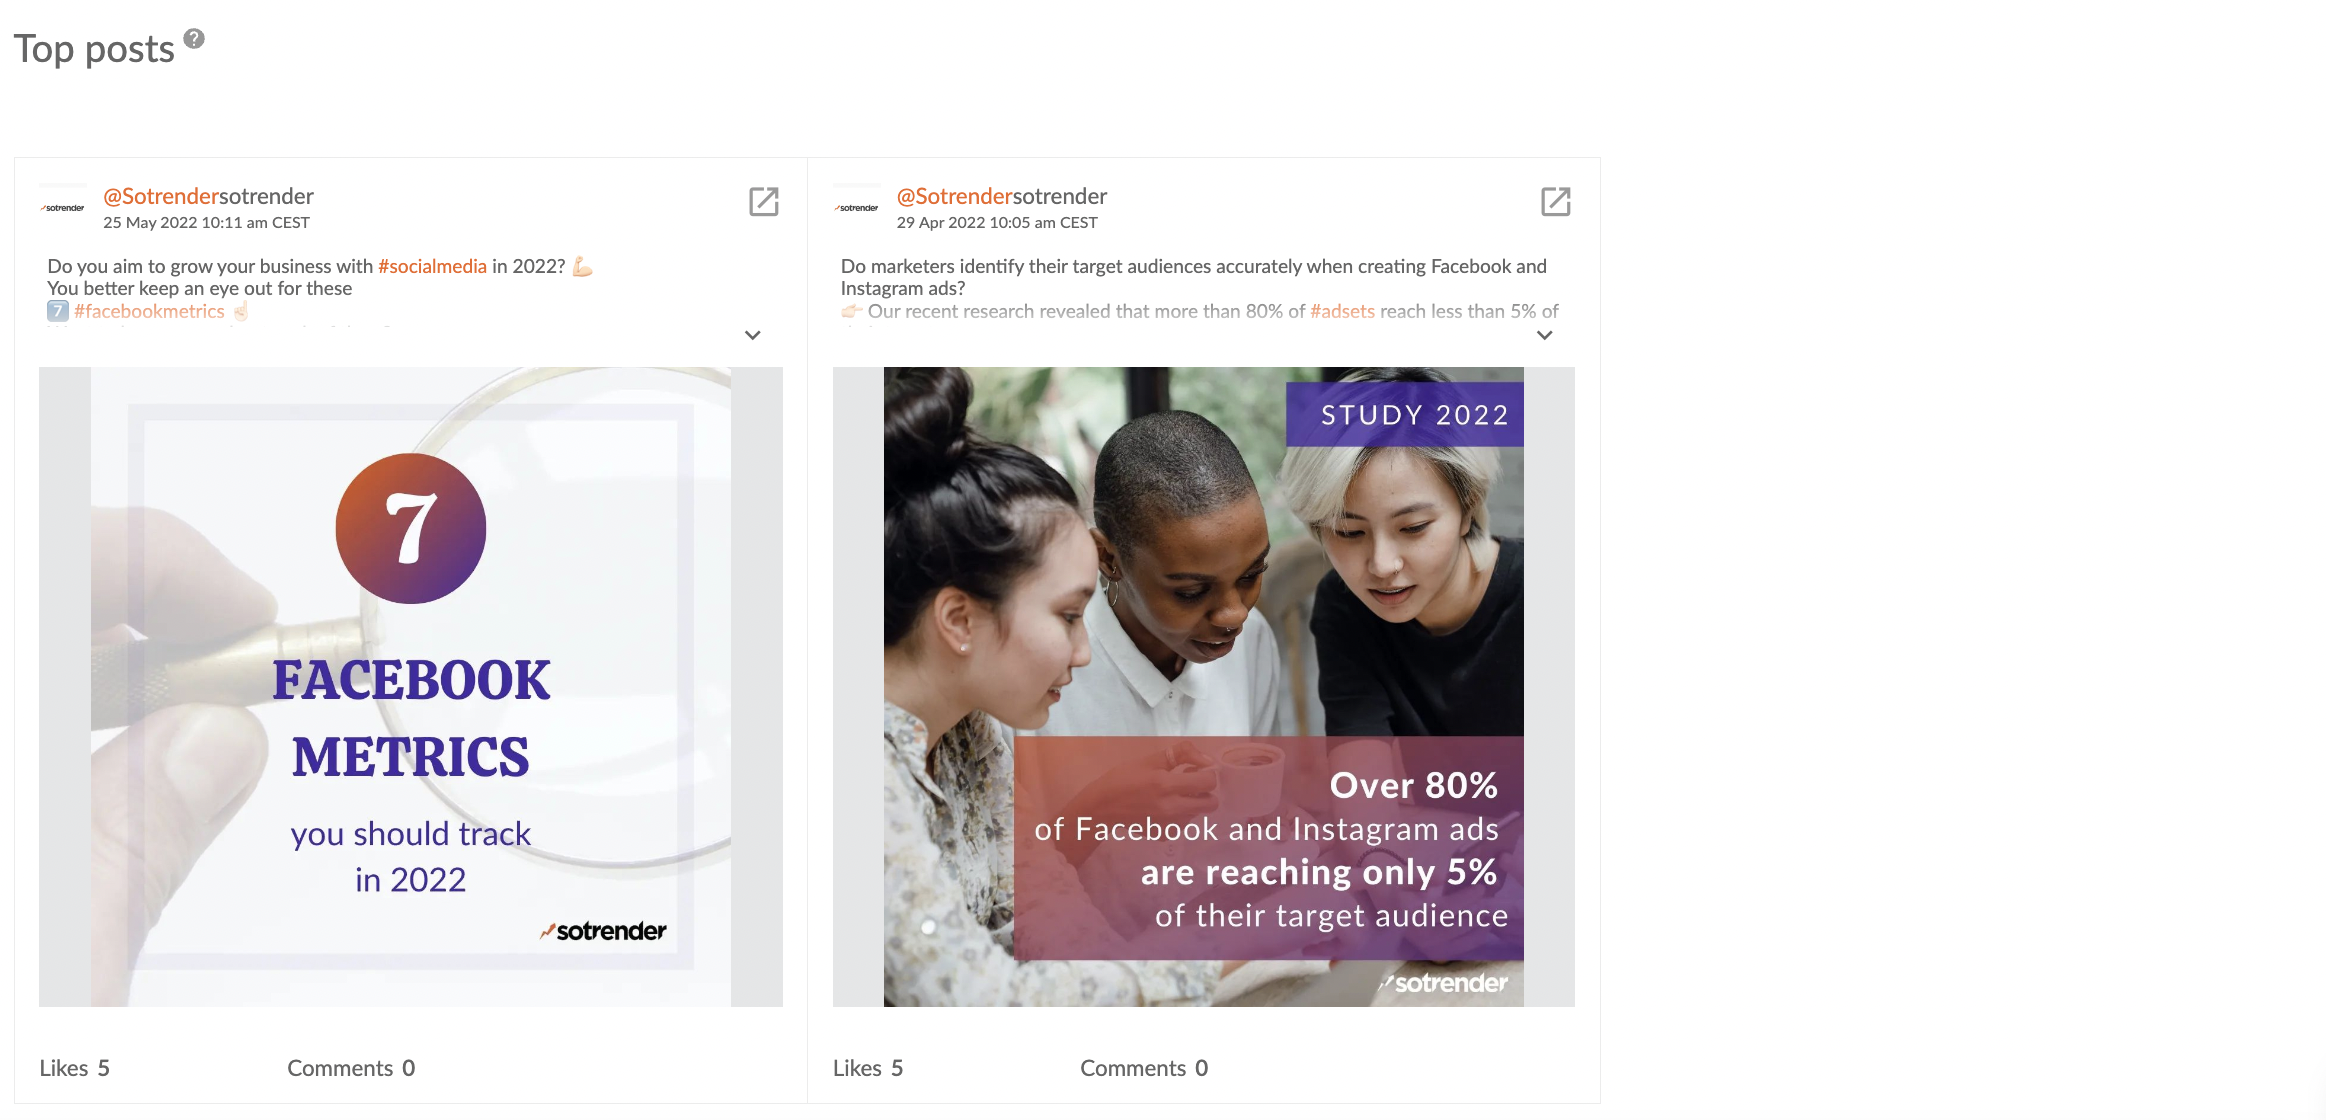
Right after connecting your profile to the app, you can head over to the Content section and Top posts tab specifically.

Checking your Instagram top posts in Sotrender is pretty easy
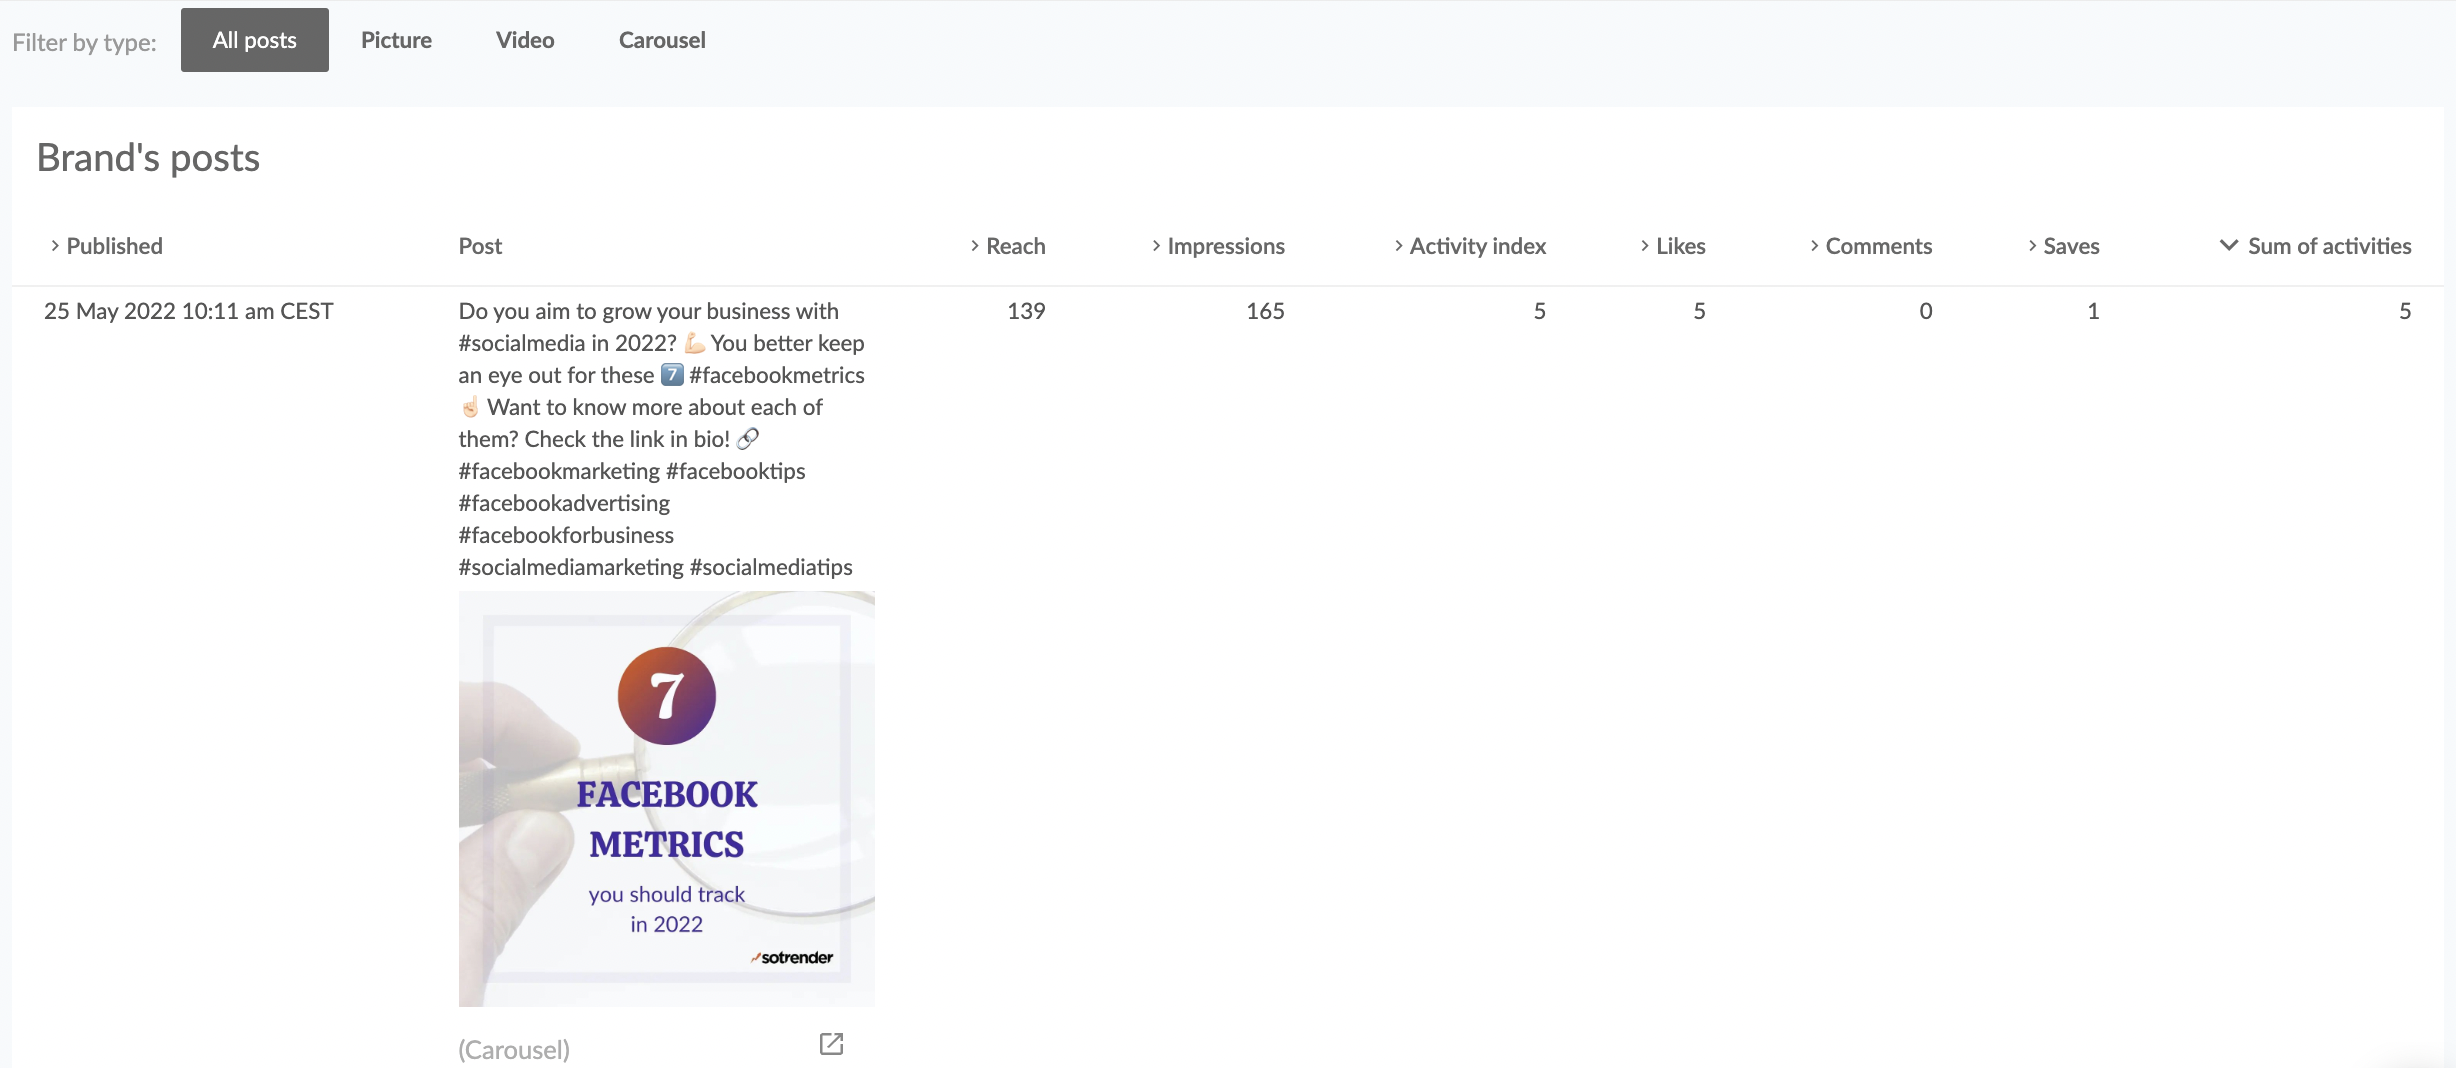
To get the most out of your data, you can sort all your posts from a selected time period by:
- total reach,
- number of impressions,
- Activity Index (total engagement),
- number of likes,
- number of comments,
- number of post saves,
- the sum of all activities.

Checking your brand’s posts in Sotrender
For your convenience, by clicking on the post preview you’ll be redirected to your post on Instagram (for example, if you need to check this post’s comments specifically).
Note that you can analyze all your Instagram Stories in a similar way, too.
By using Sotrender, you’ll also be able to monitor which content categories were performing the most effectively in terms of reach or Activity Index (total engagement).
Simply tag each of your posts in Sotrender (all the tags are custom) and you’ll automatically learn what types of posts should be published more often to increase your reach, for example. That could be industry news, product launches, events, HR announcements, and more. You name it. 😉

Analyze your content performance in Sotrender
To get an even broader understanding of your posts’ performance, consider heading to the following sections in Sotrender:
User activities
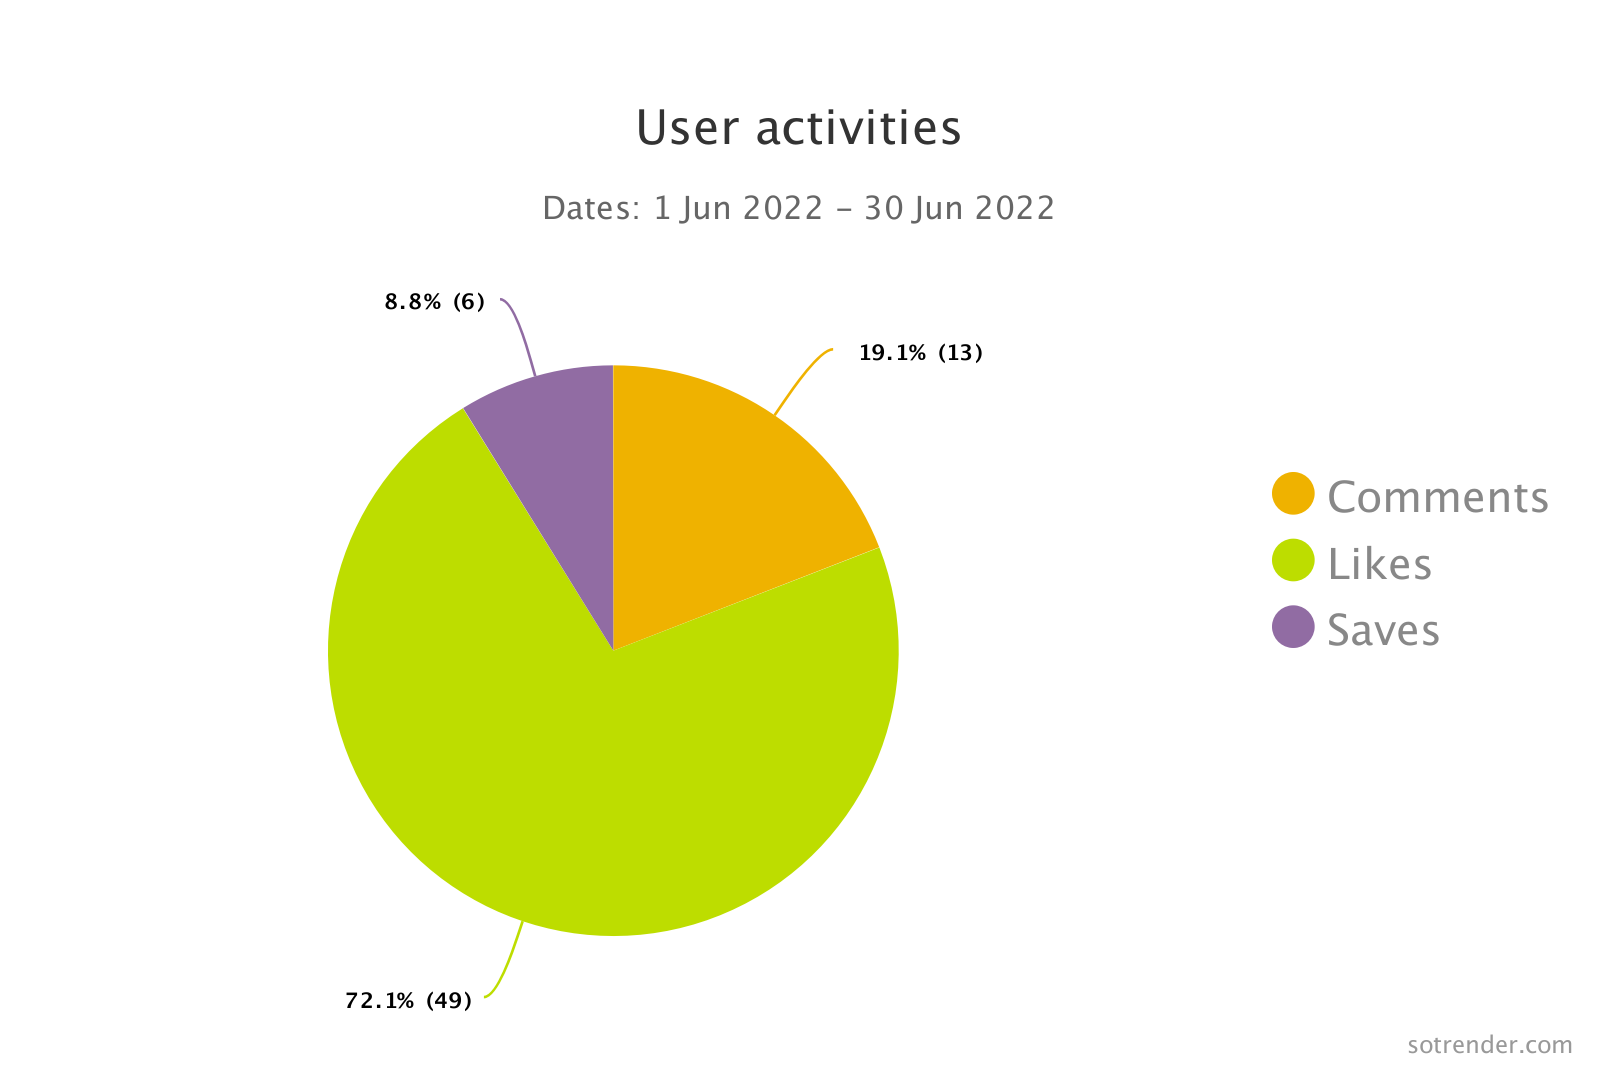
Do you know how, in general, your target audience interacts with your content?
If your goal is to engage Instagram followers, you’ll be happy to see mostly comments, shares and replies on your user activities chart, instead of likes. The reason is simple: likes don’t correspond with an engaged community.

Checking your followers’ activities in Sotrender
On the other hand, a high number of saves is also a great sign, as it means your content is helpful for your followers and they’re willing to go back to your posts in the future. Consider investing more time and effort in creating similar content.
Share of activities by media type
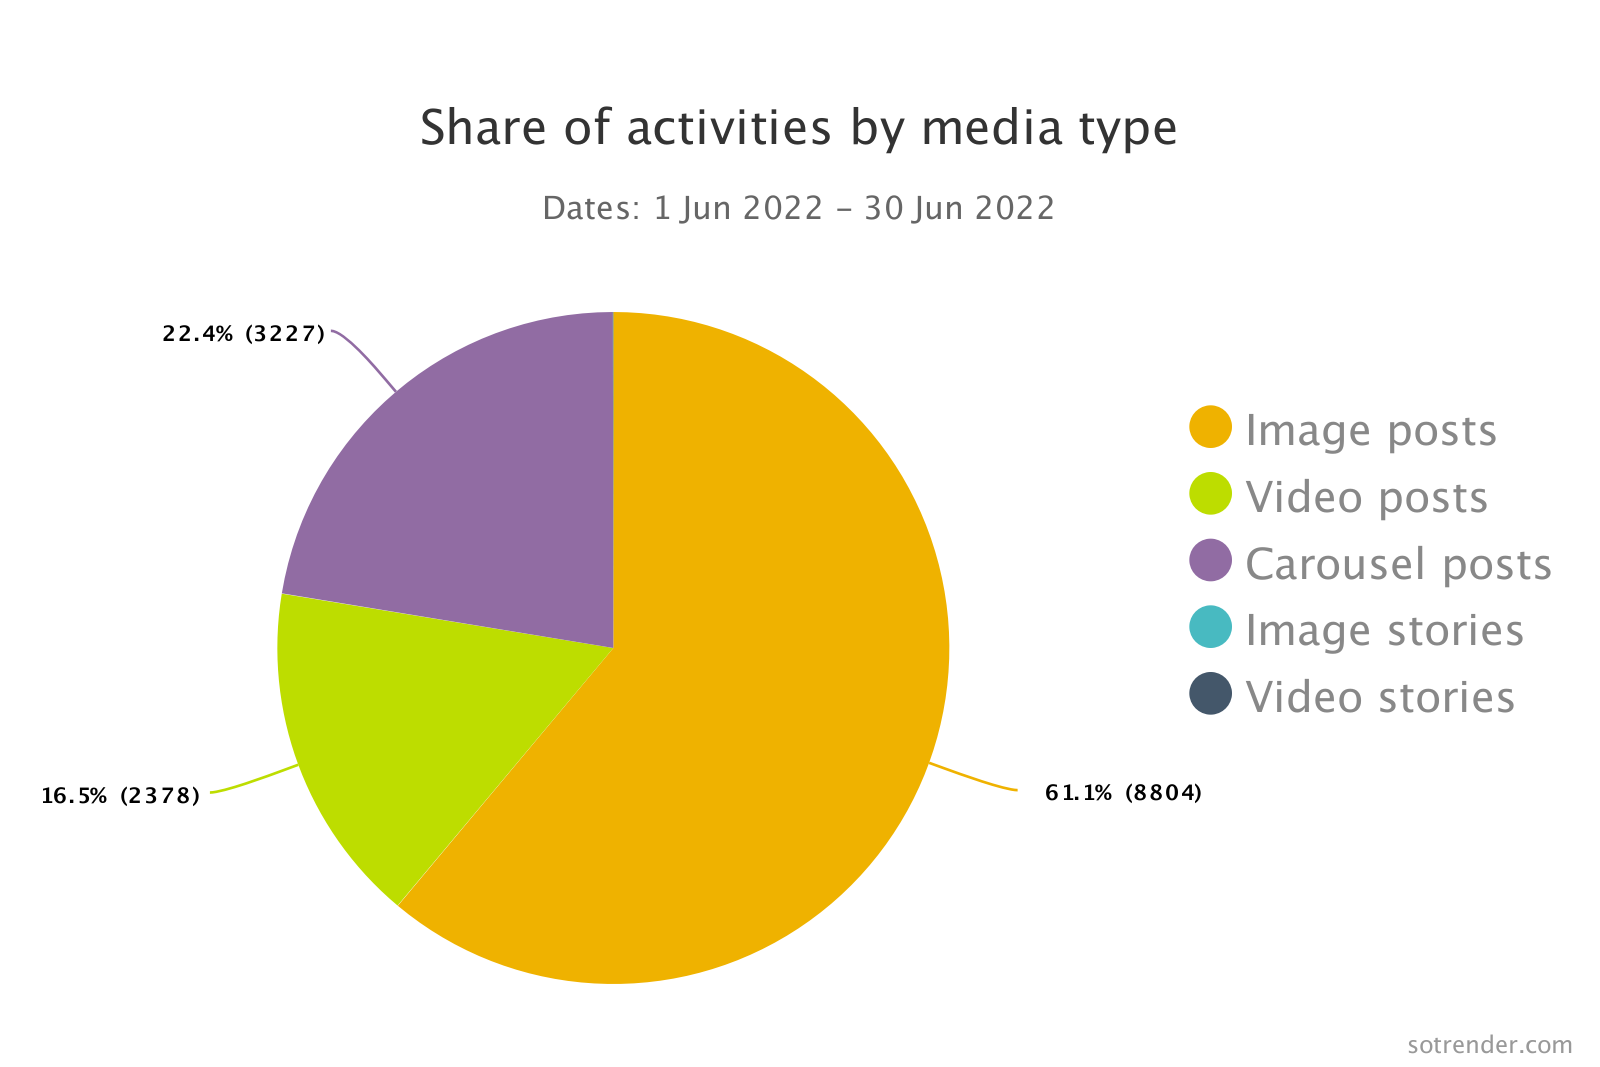
You now know how each individual post performed. But how do the activities by media type breakdown look?
Maybe your audience prefers image posts over video posts? Or just the opposite, maybe your Stories gather more activities than other types of content?
Analyzing the share of activities will give you a clear sign of which post types you should be investing more.

Analyzing share of activities by media type in Sotrender
Why should I choose an external app over built-in analytics?
Let’s quickly summarize what are the benefits of using a third-party app, like Sotrender.
- You’ll get easy access to both your current campaigns, as well as past campaigns (including ads).
- All your data will be visualized much better.
- You can track your KPIs for any time period from the past (even a very specific one).
- You’ll gain extensive knowledge about your audience and content performance.
- You’ll save time on gathering and presenting your data, as well as preparing monthly reports.
- All of that will enable you to finally make data-driven decisions that will support your business goals.
Analyze your posts and keep on creating!
We hope that now you know why Instagram post analytics is so important and how to run such an analysis.
If at some point, you feel that you’re completely drained out of content ideas, we’ve got that covered, too! Check our article with 32 Instagram content ideas that will curve any marketer’s creative block!


