Twitter offers multiple solutions and tools to help you manage your organic and paid activity. Platform that is available for all users and summarise actions and results of their profiles is Analytics.
What you I find in the panel?
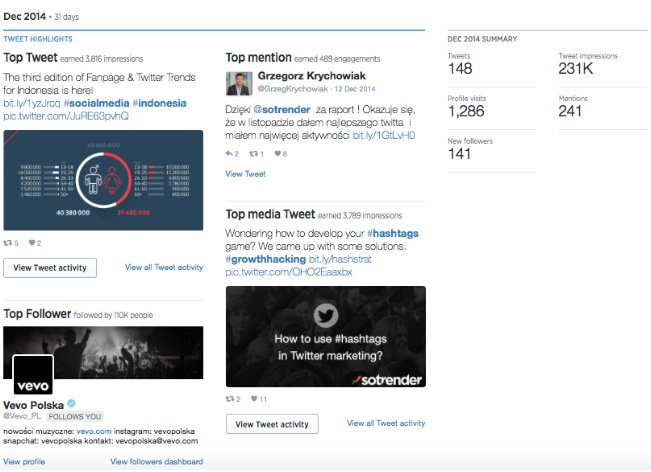
The first dashboard contains a 28-day overview of your account and monthly highlights from the last 2 years:

Monthly summary of @Sotrender profile in Twitter Analytics.
The second tab – Tweets allows you to go deeper into results. You can sort by the type of tweet, select a specific date range or export data into a csv file. This dashboard will contain both organic and promoted tweet results.
The Audiences tab will help you understand your followers: who they are (age, gender, country, language), what their interests are, and which wireless carriers they’re using. On top of that, you can compare your followers with the entire Twitter population or just a specific group of users:

Twitter Analytics contain Audience Insights tool which allows you to compare user groups.
In 2016, Twitter added ‘Event targeting’. This tab informs you about big upcoming events that marketers should consider in their strategies:

Event targeting on Twitter is easier thanks to a summary of the previous year along with highlights.
For each event you can see a summary along with the top tweets:

Top tweets for 2015 Emmy’s Awards.
The last element of the menu contains analytics for: cards, videos (beta), apps, and web tags.
The Cards tab will help you to understand what types of tweets generate the best results, which users are most influential, and how specific actions changed over time:

Cards tab in Twitter Analytics.
If you’re using Videos in communication, detailed info about their performance and completion rate can be found in the Video tab.
App manager and Conversion tracking are mainly for advertisers. These tabs are used to properly set up a connection between an app/website so Twitter can track the results of an ad.
Twitter Analytics is a great tool to start measuring the effects of your activity. It will help you understand what kind of tweets work for your business, who actually pays attention to them, and what you can improve.
For more sophisticated analytics, custom reports or the ability to benchmark, you can contact us at support@sotrender.com.


