Facebook and its advertising system is always the source of doubt and controversy. The reasons for that include the system’s size, complexity, and the varying levels of user education. But let’s not forget one of the most important reasons: sometimes the social media giant doesn’t give users enough of an explanation. Because of this, one of the mysteries that marketers struggle with is the PTAT (People Talking About This; storytellers) metric.
What is PTAT?
Facebook doesn’t offer anything more than an ambiguous definition of this indicator. In order to learn what it actually means, we need to use data from other sources. Basic information can be found in Facebook’s Insights API documentation. That’s where we find the ‘page_storytellers’ indicator, which is explained as follows:
The number of people sharing stories about your page (‘People Talking About This’ / PTAT). These stories include liking your Page, posting to your Page’s Timeline, liking, commenting on or sharing one of your Page posts, answering a Question you posted, RSVPing to one of your events, mentioning your Page, phototagging your Page or checking in at your Place.
So you can see the PTAT has a much wider definition than just engagement. On top of that, it can also include results that occurred after a page sponsored, for example, events or posts (dark/unpublished page posts). So it wouldn’t be accurate to compare PTAT and engagement directly. But that’s not the only challenge.
Does PTAT change every time I reload a Page?
It’s possible. The number of storytellers refreshes itself in real time (almost; it’s actually every 15 minutes). Each time it refreshes, the metric will refer to the last 7 days.
So how does PTAT work in practice? Let’s look at an example. A metric registered on Wednesday at 12 PM will contain all the people who ‘created a story’ no earlier than 7 days ago. That means it won’t contain people who performed the same action on the same Wednesday, but at 11:25 AM, for example.
But I heard Facebook has a deprecated PTAT metric
Facebook has informed users about the deprecating PTAT, but only in Insights. To replace it, they’ve decided to show us more detailed indicators:
To better see how people interact with a pages content, the PTAT metrics have been split into separate elements: Page Likes, People Engaged (the number of unique people who have clicked on, liked, commented on, or shared your posts), Page tags and mentions, Page checkins and other interactions on a Page.
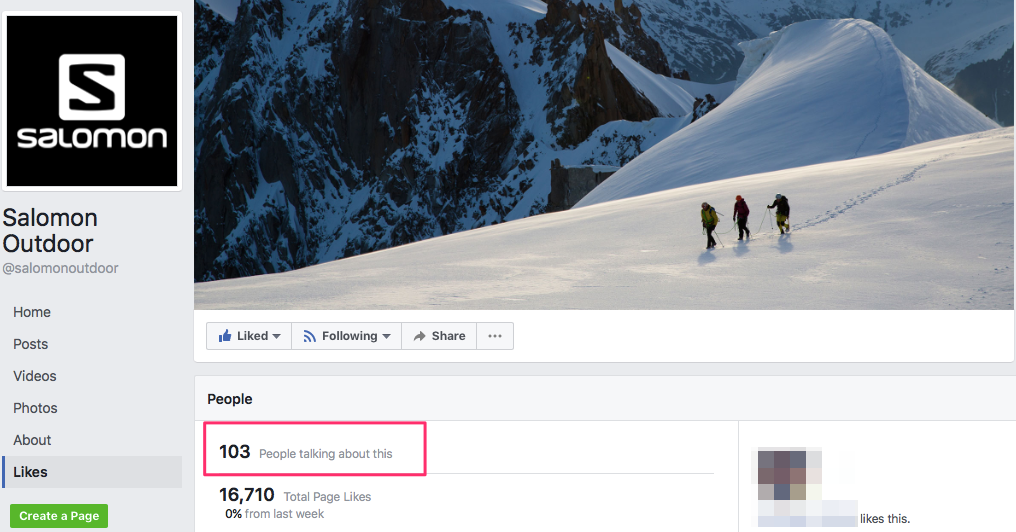
On most Pages PTAT is still visible for everyone under the ‘Likes’ tab:

People Talking About This
If there are so many problems, why bother showing Storytellers?
In the new version of our Trends reports, next to Engagement, we’ve decided to show the number of Storytellers. We even added them to our app! If you’re still wondering why, don’t worry about it. We’ll explain.
The PTAT metric demonstrates how people interact with a Page across a much wider context. According to the definition, the only connection between the data from Facebook Insights and public data is the number of Storytellers itself (which we publish in Trends reports). In other words, the data from non-public brands, which is unavailable to the wider public, is somewhat represented by the PTAT metric.
Is this data reliable?
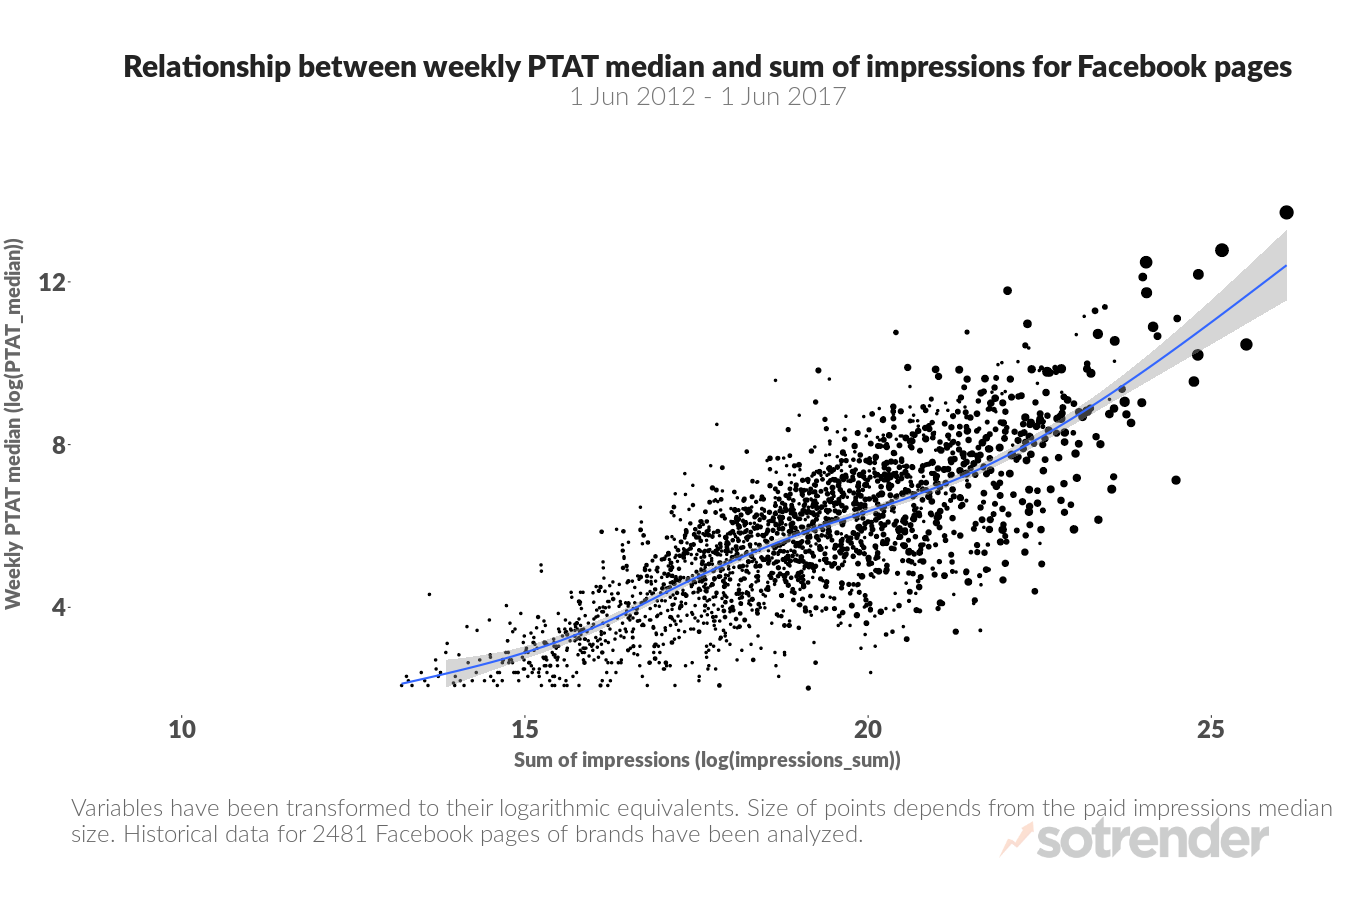
We wouldn’t be Sotrender if we didn’t check! But.. how did we do that? This indicator is strongly correlated with Page reach and is the only one that better demonstrates a correlation with paid reach.

Relationship between weekly PTAT median and sum of impressions for Facebook pages
FROM THE CHART:
- Weekly PTAT and sum of views on Facebook correlation.
- PTAT median.
- Variables have undergone a logarithmic transformation. The size of the points depends on the median of the paid reach. The historical data for 2,481 Brand Pages was analyzed.
Of course, the relationship mentioned above is not straightforward and far from a simple linear correlation (although we also observe a high coefficient regarding Facebook data). However, we can see quite a high-rank correlation coefficient.
Let’s translate this analytical slang into normal English: the higher the PTAT metric, the greater the reach. But this positive effect is not clearly defined. So we can’t say how much reach will increase if PTAT has increased by 10 points. However, the probability that it has increased is greater than the likelihood that it has not.
The PTAT metric is correlated not only with reach but also with paid reach, which is unique. It is the only indicator that in some way gives us the number of paid views, although with some margin of error. But most importantly, this indicator is moderately correlated with views, as long as they did not have the effect of clicking on an ad, making a story, etc.
To present all these relationships in chart form isn’t easy. Especially with data this noisy and full of outlier observations (which can not be eliminated for various reasons), as both variables were logarithmic.
However, we can definitely say that the higher the weekly median of storytellers per month, the greater the total number of views (including paid).
How does Sotrender calculate PTAT for Trends Reports?
PTAT is a very atypical metric. It’s a challenge for us to represent it in our Trends reports. So how do we go about doing it?
Throughout each and every day, we ask Facebook’s API for the number of Storytellers for each Page in our database (on average, this takes place every hour). At the end of each month, we collect the hourly results and calculate the median, which we treat as a daily value. Based on those, we calculate the median for each profile, which we treat as a monthly value.

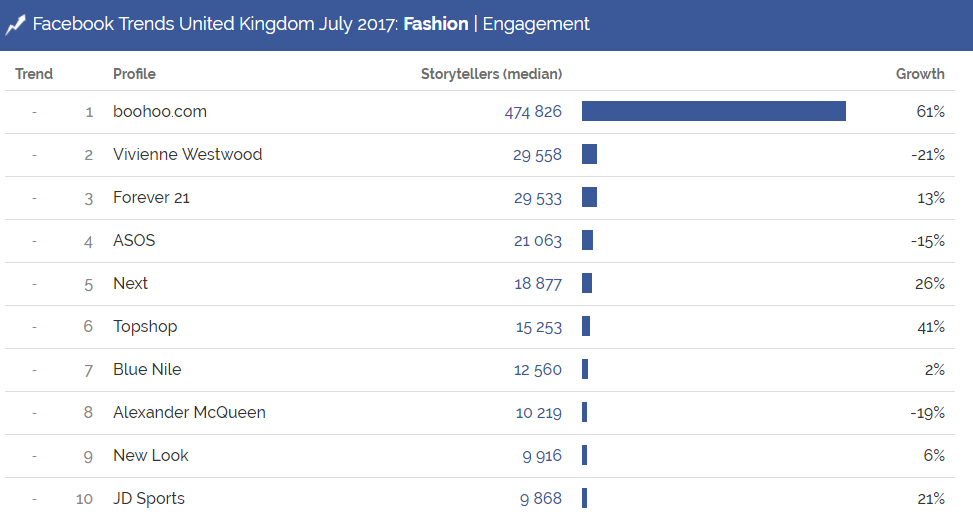
Fashion in UK’s Facebook Trends, July 2017
Summary
The PTAT metric is definitely not a favourite of admins and Facebook Page owners, mainly because of its complexity. But after long consideration, we’ve decided that Trends reports are significantly more interesting after including them. It helps us to better show how UK’s Facebook is doing – especially since ads are an integral part of it.
Would you like to know more about your competitors paid activities? Order our Paid Communication Analysis.


