Analysis and reporting are inevitable elements of each social media manager’s work. As it can be a tedious and time-consuming task, it’s good to know how to make this whole process smarter and faster.
Today, we’ll be looking specifically at Facebook ad reporting. Are you curious about how an ideal report should look like and whether there are any tools that can help you along the way?
If your answer is yes, keep on reading.
Why is Facebook ad reporting so important?
Why is the task of preparing and delivering a report summarizing your Facebook or Instagram campaign so significant?
There are two main reasons.
- You need to know if your campaign was a success or not, and if you achieved your goals. Also, it’s important from the strategic point of view – you should be comparing your campaigns to each other to draw conclusions and make strategic decisions.
- You’ll need to report the performance of each campaign to your boss or client – they’ll simply expect from you monthly reports. After all, as Facebook ads are all about spending money, the person whose budget you’re spending will be monitoring carefully those costs as well as the return on investment.
We know it may not be the fanciest task, nor your favourite one. Though the reality is that if you’re setting Facebook ads, in 99% of cases you’ll be asked to prepare such reports as well.
That’s why we want to show you how to prepare such reports easily, to make Facebook ad reporting quick and effortless each month.
Start analyzing your ads with ease
What does a perfect report look like?
If you have never created a Facebook ad report before, you may not be sure how such a document should look like and what data it should contain.
There are some best practices that you may find helpful.
Facebook ads report need to be:
- Condensed & short – a report is a summary of a campaign, so you don’t have to include in it all the metrics that you have at your fingertips.
- Prepared with a campaign objective in mind – think which metrics are relevant to be reported for each campaign. A report summarizing a reach campaign should contain different KPIs than, for example, a report for a campaign focused on traffic or engagement.
- Structured and easy to follow – you should start with a summary with key KPIs, the goal of your campaign and any other information that is crucial to understand the report properly. Then you can move to your metrics: start with the basic ones, like reach or cost-related ones, before presenting detailed ones.
- More than just raw data – even for professional marketers it will be hard to make meaningful conclusions quickly just by looking at many numbers in a spreadsheet. That’s why data visualization is very important.
The rules are simple, but I guess you may be a bit confused now. How to visualize this data and make it appealing for the reader? How to keep the report short but informative at the same time? Which data should you focus on?
We can’t read your mind, but we’re pretty sure we know what your thoughts are now: it looks like preparing such a report is pretty challenging and time-consuming. So you may also wonder if it is possible to speed this process up, and not be ashamed of the report’s visual side at the same time. Because finally, you will be presenting your Facebook ads report to your team or boss.
We have good news: there are tools that can help you along the way.
Let’s talk about them now.
Where to get my report from?
If you’ve been setting and reporting Facebook ads for quite some time now, you’ve most probably already figured out where to get the data from, what is the fastest way to prepare a report and what your boss actually expects to see inside.
But if you’re a newbie or you’d simply like to enhance your monthly Facebook ad reporting process, we’ll guide you through possible ways of getting a Facebook ads report quickly.
Option 1: Manually report Facebook Ads Manager data
As you may already know in Facebook Ads Manager you will find quite a lot of data informing about the performance of each of your campaigns. You can also export those data, though that would be just an Excel spreadsheet with raw data.
How to export my performance metrics from Facebook Ads Manager?
You should start by going to Facebook Ads Manager, and then:
- Specify the reporting period (in the calendar in the upper right corner)
- Choose the campaigns, ad sets or ads that you want to generate the report about
- You can also specify what kinds of metrics you want to export (e.g. engagement related metrics or rather just setup metrics or targeting data)
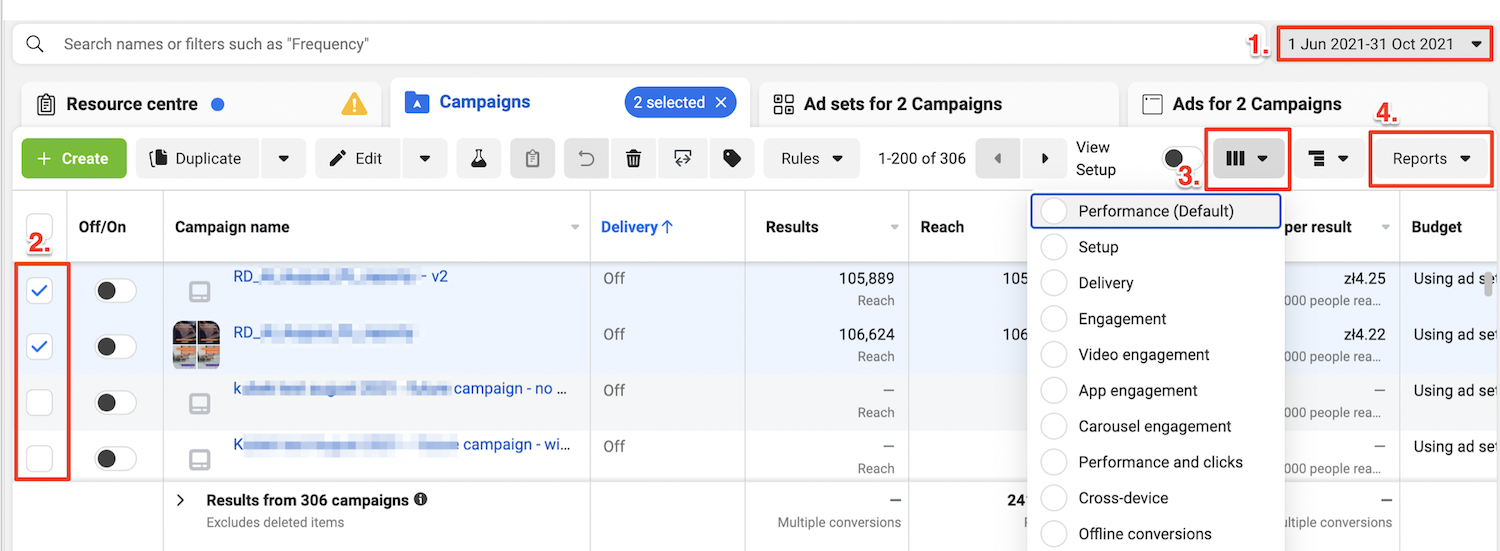
This is how the process of exporting your ads data from Facebook Ads Manager looks
Then, click “Reports” on the right, where you just have to decide on the format of your export. As you’ll see such a report can only be downloaded in .xls or .csv format.
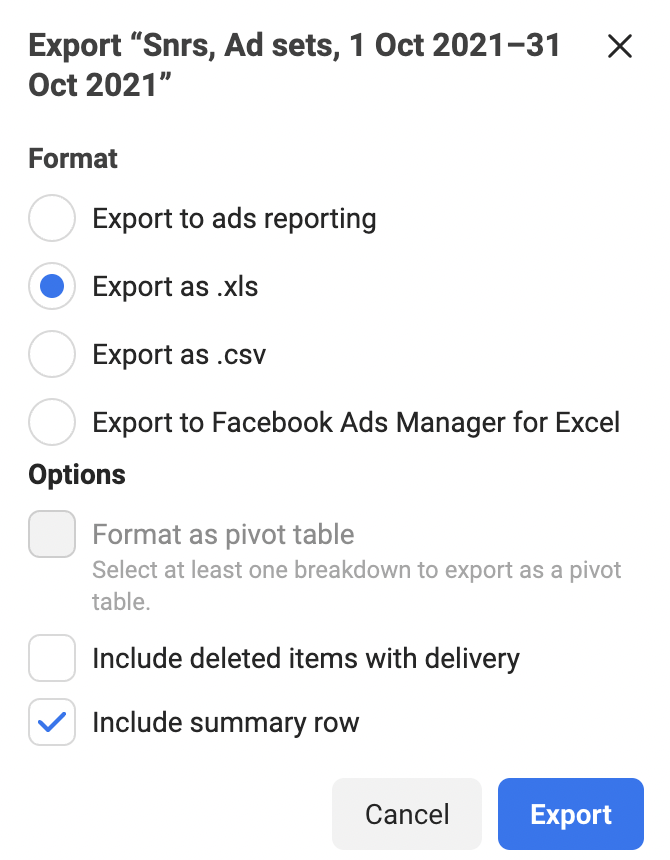
Available export formats in Facebook Ads Manager
Such a report, or to be more precise – a summary, is not really what your supervisor or client is most probably looking for. It’ll be simply hard for them to draw any conclusions just by looking at such a set of raw data presented in a spreadsheet.
Go back to the four best practices for Facebook ad reporting that we’ve talked about at the beginning. I guess we can all agree that a basic spreadsheet does not meet those requirements. 
That’s why it seems that choosing the second option, which we’ll tell you more about now, is a much better solution.
Option 2: External social media analytical apps
There are, though, external applications that are dedicated to generating professionally-looking Facebook ads reports. One of them is, for example, Sotrender.
Sotrender is a well-known social media analytics app in which, for some time now, marketers could only find data informing them about their organic social media performance. Times have changed, and now Sotrender offers also Sotrender Ads, in which, as you can guess, it’s possible to analyze and report your Facebook ads performance.
Why will you benefit from using Sotrender as your reporting tool?
- It takes literally less than 60 seconds to get your report ready. Think how much time you are now spending on preparing a report summarizing one campaign.
- All the data you’ll choose is automatically visualized on charts, so it’s really easy to go through the report and understand what’s in there.
- The report you’ll get is a complete document, so right after downloading it, you can forward it to your supervisor. It’s worth noting, though, that you’ll still be able to make any edits, if necessary, as your report will be downloaded in an editable PPTX format.
- Every report can be obviously customized, for example by adding your client’s logo or a comment.
Let me guide you through the process of Facebook ad reporting in Sotrender:
- Log in to Sotrender (or create an account, if you haven’t already).
- On the left-hand side, choose Sotrender Ads.
- Choose campaigns you want to report (you can also select only specific ad sets or ads that you’re interested in at a time).
- In the upper right corner click ‘Download report’.

Downloading the ads report in Sotrender Ads
5. Choose which metrics you want to include in your report. By default all of them will be auto-selected, so you basically can unselect some, if you want.
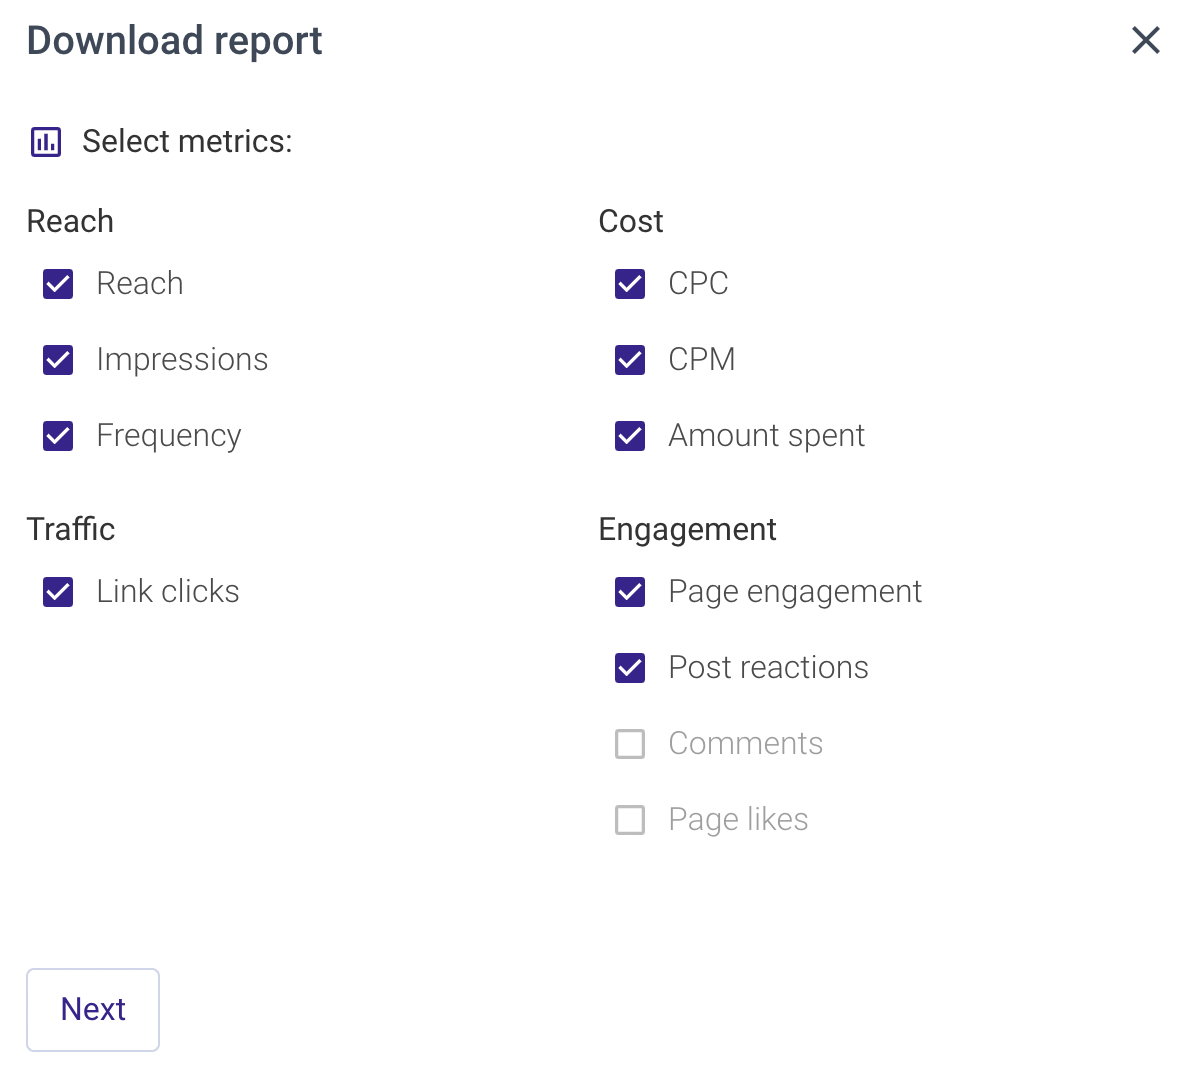
Choosing metrics in Sotrender Ads
6. The next step, which is also optional, is adding your (or your client’s) logo and comment that will be shown on the first page of your report. Here you’ll also see the summary: what campaigns (or ad sets or ads), time period, and metrics you’ve chosen.
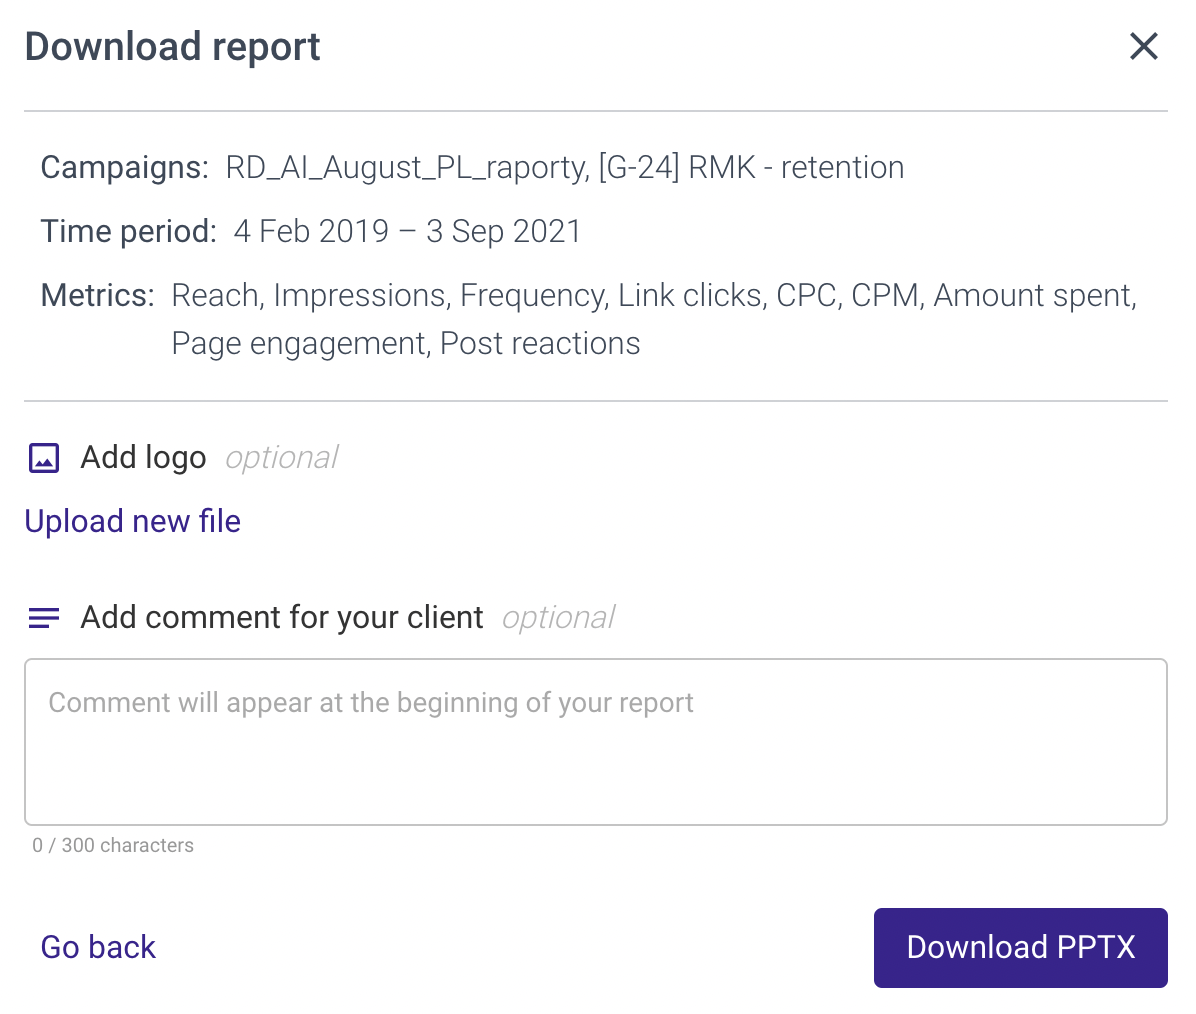
Summary of your report in Sotrender Ads
7. Click ‘Download PPTX’ and your report will be ready in a while!
And that’s it! Your report will be ready in less than 60 seconds.
Generate your Facebook ads report
Here are just a few examples of how such a report looks from the inside.
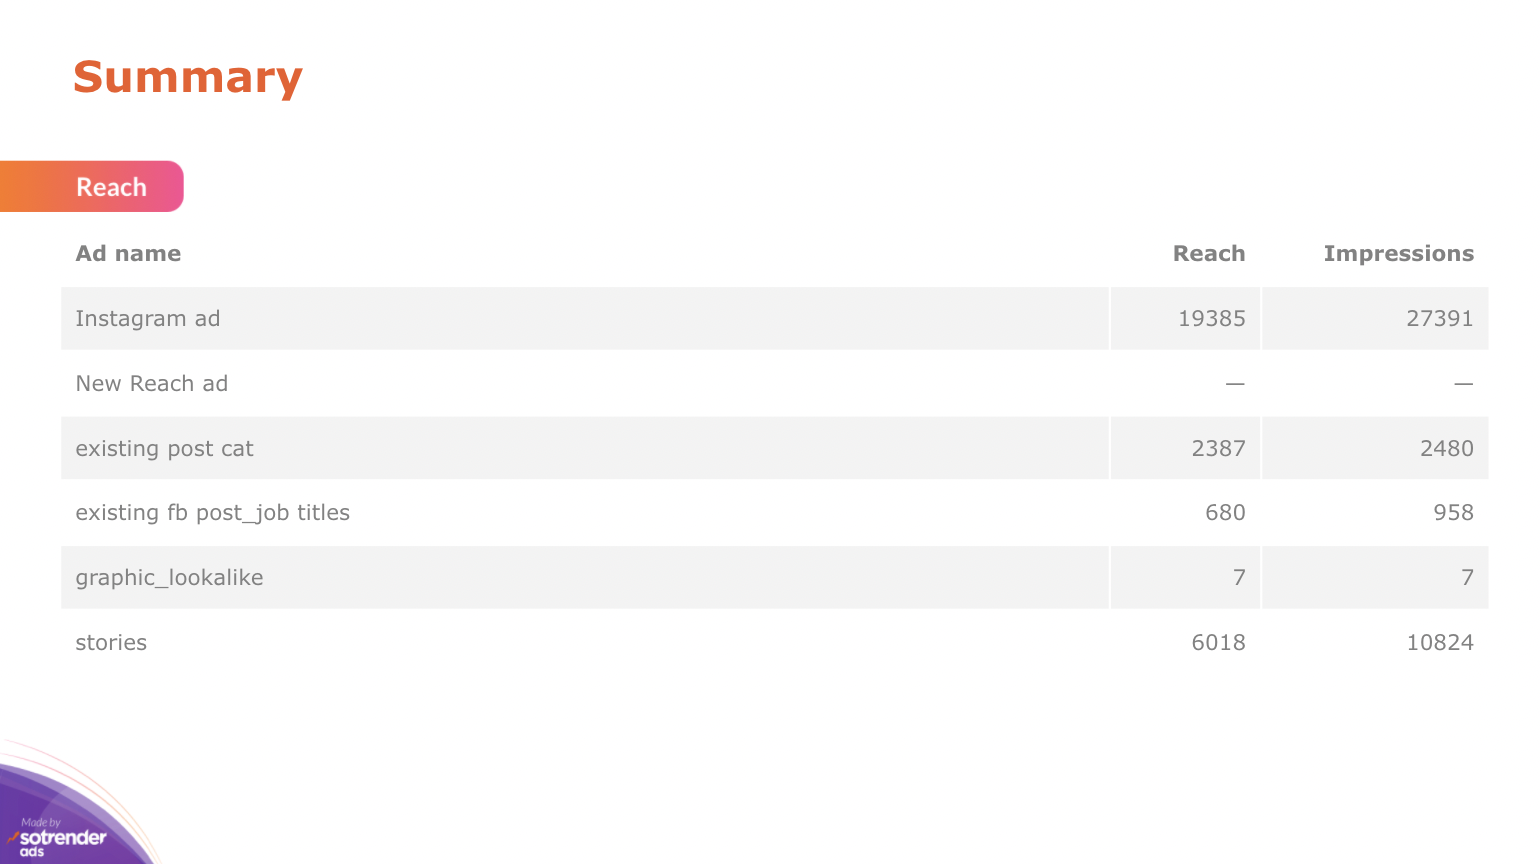
Summary page, Sotrender Ads
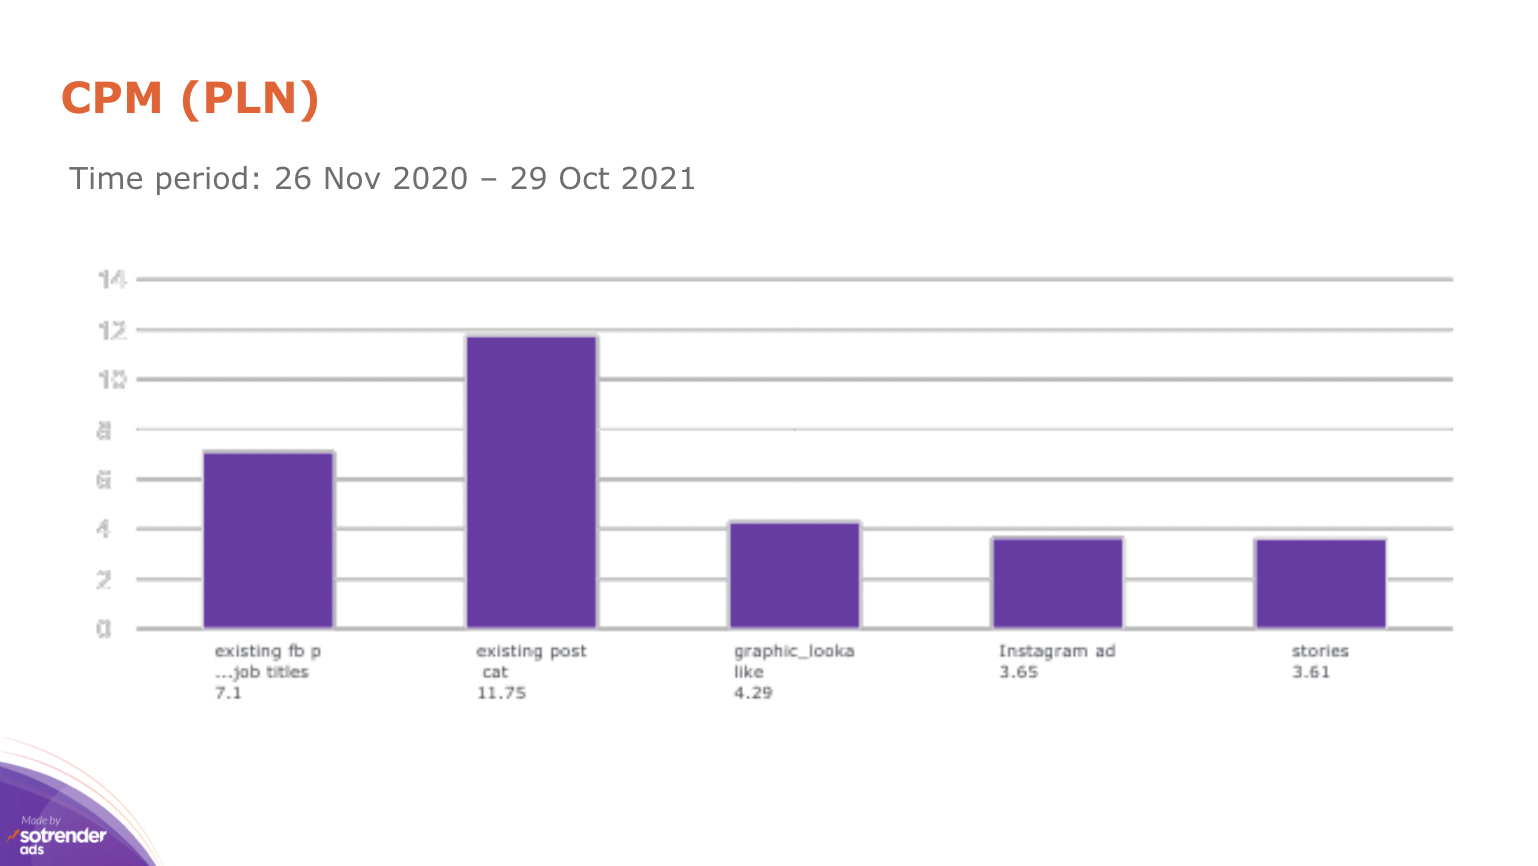
Information about the CPM cost in Sotrender Ads report
Remember that in Sotrender you can also generate reports summarizing your organic performance, but also comparison reports informing about your competitors’ organic results.
Facebook ad reporting – the reader’s perspective
Most probably you’ll be handing your report in either to your boss or client. That’s why you should keep in mind a few rules that will ensure your report is clear for people that are not necessarily experts in digital marketing and social media.
What are these rules then?
- Your report should be quite short and contain only key metrics – include in your report only those data that matter from the perspective of a specific campaign and for a specific recipient (you may need a slightly different report for a client and for your team members).
- The visual aspect of your report is very important – data presented on charts are easier to digest and understand.
- Point out what was the best in your campaign, for example, include examples of ads that performed the best (e.g. gathered the highest engagement or conversions). Showing the examples will also help the reader to get a better understanding of what the report is about and what the campaign was about.
- If it’s necessary, include your comments in the report or metrics explanation – depending on who is the recipient of your report.
Reporting Facebook Ads – bottom line
When creating any report, you have to keep its goal in mind and who you’ll be presenting it to. Yearly or quarterly reports should look in a different way than a report summarizing just one campaign. The same goes for the recipient – a report that you’ll be discussing with your team members should be much more detailed than the one handed to a client or a CEO.
Facebook ad reporting is a very repetitive, sometimes even tedious, task. The truth is, every marketer or social media manager has to do it, but it’s your decision which tools you’ll be using along the way and how pleasant this responsibility will become.


