The success of every product depends on how well it fulfills the needs of its users. Creating a positive and useful experience for your end-users is the best strategy there is to gain their trust and loyalty.
Every decision you take while designing user experience directly affects the overall customer journey. The better customer experience you craft, the more success your business will have. Your main goal while designing UX should be to create an experience that aligns your business goals with customer needs. But how will you figure out what your customers need? How will you figure out their changing behavior and preferences? Well, the answer is UX analytics where you’ll be dealing with a lot of data – both quantitative and qualitative.
What’s measured gets managed. Numbers have an important story to tell.
— Peter Drucker
Making decisions based on data will always help you achieve your goals. Assumptions or blindly following current trends, however, will lead to poor design. And we all know what poor design can do to your brand image.
So what exactly is UX analytics? Why is it important for every business? And how do you leverage it to make data-driven design decisions?
Let’s dig deeper to get a better understanding.
What is UX Analytics?
The process of analyzing and measuring user activity on a website or an app to gain a better understanding of how users interact with your designs is called UX analytics.
You can use the insights gained from this process to better your design and according to what your end-users want.
The users’ activity can be measured using quantitative and/or qualitative tools. Based on your business goals, you can use either quantitative or qualitative or a combination of both kinds of tools.

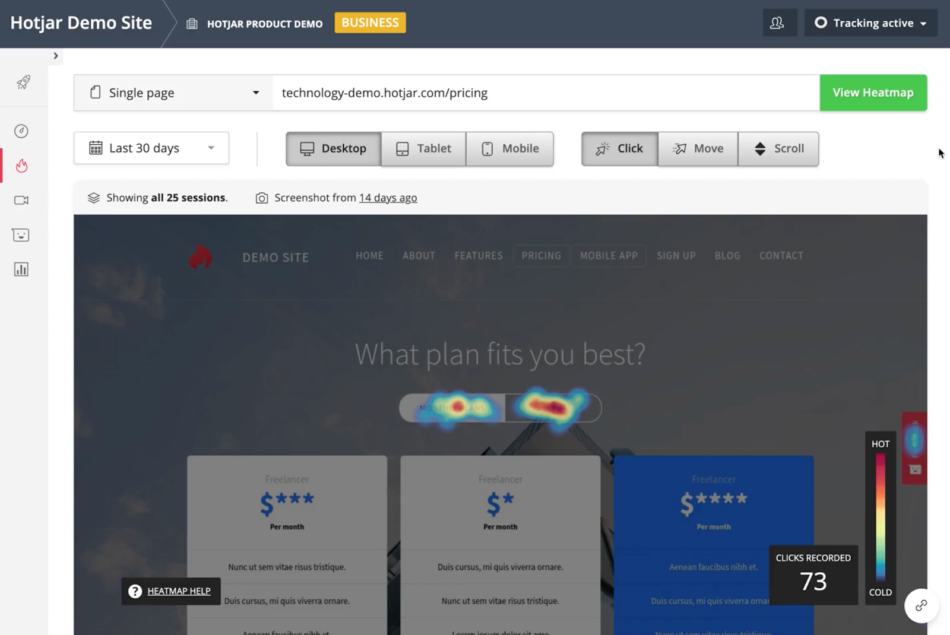
source: Hotjar
Quantitative data will tell you where your customers are clicking, which elements are they interacting with whereas qualitative data will tell you the ‘why’ behind their actions.
Quantitative analytics is expressed using graphs, charts, etc. basically everything that helps visualize numbers. You can use tools like Google Slides for presentations, graphical abstract maker for graphs, etc. Since qualitative is more about understanding user behavior in detail, presentations and documents are the best way to express the insights gathered from the data.
To gain a detailed understanding of qualitative and quantitative methods, you can read this article on the same topic by UXCAM.
From our experience: Keeping data aside, make sure you are tuning into your design instinct which comes from your own experience and knowledge. Data can support your intuition but it’s not a substitute for it.
The Role of UX Analytics
The primary role of UX analytics is to help you assess customer feedback without interacting with them directly. When they interact with your product, website, or app, they are giving their feedback through their behavior and actions. If you are not tracking and gathering this data, then you are losing out on a lot of potential opportunities.
UX analytics provides you with the opportunity to test your design intuition and develop it gradually. For example, if you feel that placing a call-to-action button on the right side of the banner will get you better conversion rates, then you can use one of the quantitative tools that allow you to run A/B tests. Using these types of tools, you’ll be able to assess which placement performed better.
Here are a few other useful uses of analytics for creating a better user experience:
- Since you’ll be able to track their movements on your website, app, or product, you’ll know the exact moment when they left. Based on their interaction and exit point, you’ll be able to assess why they left. Such analytics allow you to create better digital experiences and products having higher conversion rates.
- Bring down the exit and bounce rates by using the same data to optimize your customer journey.
- It’s quite easy to miss out on accessibility while making design decisions. UX analytics help you rethink your decisions from this perspective. Being inclusive should be embedded in your value bank.
- You’ll also be able to create a better layout for your content, a layout that your visitors, end-users, and customers will love.
In the end, UX analytics will help you create engaging, intuitive, and better experiences for your customers. Providing a seamless experience used to be a differentiator but not anymore. It’s a necessity for every product, website, and app.
To create such seamless experiences, you’ll need a combination of powerful and insightful qualitative and quantitative UX analytics tools. After analyzing more than 20 tools, we’ve curated a list of top 5 UX analytics tools that you need in your stack in 2021.
Top 5 UX Analytics Tools – Qualitative & Quantitative
- Kissmetrics – Helps you create funnels and reports based on the data collected from customers’ interactions.
- Mixpanel – A product analytics tool to measure and improve customer engagement and retention.
- Google Analytics – For a better understanding of your traffic, ROI of your paid campaigns, etc.
- Tableau – A visual analytics tool that helps make sense of data at an organizational level.
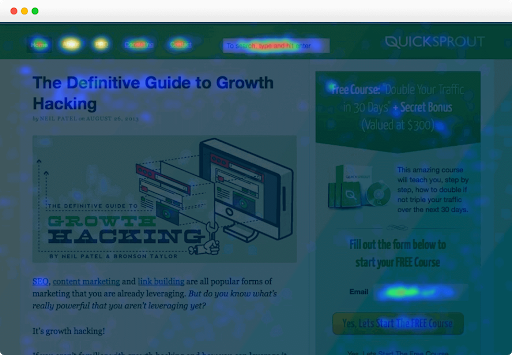
- Crazy Egg – A heatmap tool to help you assess the movement, clicks, and other actions taken by your customers.

source: Crazy Egg
Now that we have a clear understanding of UX analytics, its role, and the tools you need, let’s jump in to understand how you can leverage it to make data-driven decisions.
How to Leverage UX Analytics to Make Data-Driven Decisions
1. Understanding Users
As we’ve mentioned a couple of times in this article, UX analytics helps get a better understanding of your users, where they come from, what they did on your website or app, why they left, how they are engaging, and what’s making them come back.
The right UX analytics tool can help you:
- craft personalized surveys to gather reliable information,
- segment your customers based on their behavior, devices, etc.,
- analyze customer behavior,
- and understand important aspects contributing to your customer lifetime value.
2. Data In, Trial & Error Out
Using trial and error methods to derive conclusions can be quite expensive and time-consuming. Having the ability to get real-time data as and when required can help make quicker and more accurate decisions. More importantly, using UX analytics tools that provide role-based access can help keep everyone on the same page without having the need to conduct redundant meetings.
3. Better Marketing, Better Sales
All the business activities are interconnected with each other and to some extent, interdependent.
Let’s say while creating the SEO strategy for your online business, you notice that your visitors are completely ignoring a better part of your product pages. Most of them stop at the image slider which, instead of re-engaging your visitors, kind of gives the feeling of the page end. Here customers will be leaving without getting a chance to understand your product which might impact the sales of your product. It might also affect the marketing department as they will experience a higher bounce rate which can directly affect page rankings and which, in turn, again affects sales.
On the other side, if you use UX analytics to create a better experience for your customers and optimize their journey on your website or app, it will directly help the marketing department. They will update all their marketing collateral, redefine their goals, and re-strategize marketing, content, & SEO to align with the optimized user experience and journey. And as you can guess, this will directly help the sales department to convert leads into paying customers.
So, the more you use UX analytics for design decisions, the better it will be for your marketing, sales, and product departments.
4. Improved Customer Retention & Engagement
Customer demands are always changing and it becomes quite hard to keep everything updated to cater to their needs and demands. This is where UX analytics come into the picture. By tapping into the potential of real-time user analytics, website usage analytics, and heatmap analytics, retaining and engaging customers can become a cakewalk for you.
With regular and accurate updates about what’s converting them and what’s obstructing their experience, you can make iterative changes that will make their experience positive.
UX Analytics Best Practices
Selecting the right method and the right mix of tools for gathering UX data is just the beginning. The real trick is to know how to evaluate the data and derive valuable and actionable insights. So here are a few UX analytics best practices you can follow to make sure you are making the most out of the gathered data:
- User expectations: To successfully assess your customers’ expectations regarding the interaction with your website or app, try to put yourself in their shoes. Make sure to consider the cultural context (their geographic location, its impact on their choices, lifestyle, & decision making) and be empathetic while designing. This will help you bifurcate your biases and assumptions from the actual expectations.
- Usability heuristics: Create a checklist of usability considerations. This will help you evaluate usability heuristics which, in turn, will help identify problems and possible solutions. Having this step before launching the changes for your customers will make your product launches more effective. Here are 10 principles for interaction design by Jakob Nielsen – a Danish web usability consultant and human-computer interaction researcher.
- Analyze steps and friction in user flow: Analyze every step in your user flow to ensure there’s no friction to complete the required action. Make sure to eliminate any unnecessary steps from the flow to make it more user-friendly.
There’s no defined UX strategy that you can follow to achieve success. It’s demand-oriented which requires you to pay attention and keep upgrading on a regular basis.
The modern UX strategy is iterative, customer-centric, and data-driven. The sooner you adopt the new ways of taking designing decisions, the more success you’ll have with your target audience.


