
We all already know that analyzing social media data is crucial. Such an analysis helps us find out our audience preferences, improve our content performance and as a result optimize our strategy. Sometimes data is all we need to impress our boss or client and prove our hard work.
But let’s be honest, no one has time to spend hours on analyzing data on a daily basis. And oftentimes it’s not even necessary.
But just like you’re checking your emails every morning, you should catch up on your key social media metrics once a day. How to do it without logging in to each social platform and looking for specific metrics each day? The answer is simple: you should use a social media dashboard.
Carry on reading to see how you can benefit from using such a dashboard and how to find the perfect one for you.
Introduction to social media dashboards
A social media dashboard is your command center for all things social media. Instead of jumping between Facebook, Twitter, Instagram, and other platforms, a media dashboard brings all your key performance metrics together in one place. This means you can track engagement rate, reach, impressions, and other vital social media metrics across multiple channels—without the hassle of logging in and out of different accounts.
For social media managers, a social media analytics dashboard is a game-changer. It provides real-time insights into your social media performance, so you can see at a glance how your posts are doing, which channels are thriving, and where you might need to adjust your strategy. With a high-level overview of your data, you can quickly identify top-performing posts, spot trends, and make data-driven decisions to boost your brand’s online presence.
Using a social media dashboard isn’t just about convenience—it’s about making smarter, faster decisions. By consolidating your social media analytics in one platform, you can optimize your content, respond to changes in real time, and ensure your social media strategy is always on point. Whether you’re tracking Facebook, Twitter, Instagram, or all of the above, a dashboard provides the insights you need to create a winning social media presence.
Social media dashboard: what it is and what it is not
Social media dashboard is a place where all your social media KPIs (key performance indicators) are presented.
That’s why such a dashboard shouldn’t be cluttered with data. It has to be easy to read and it should contain only the data that are important to you at a time. A good social media dashboard should be customizable, allowing you to tailor the displayed metrics and layout to your specific needs. Only key metrics that are most important for you.
So what should the social media dashboard look like? It would be the easiest to take a look at both good and bad dashboards examples found on the internet.
Here is how, in our opinion, a good social media dashboard looks like:
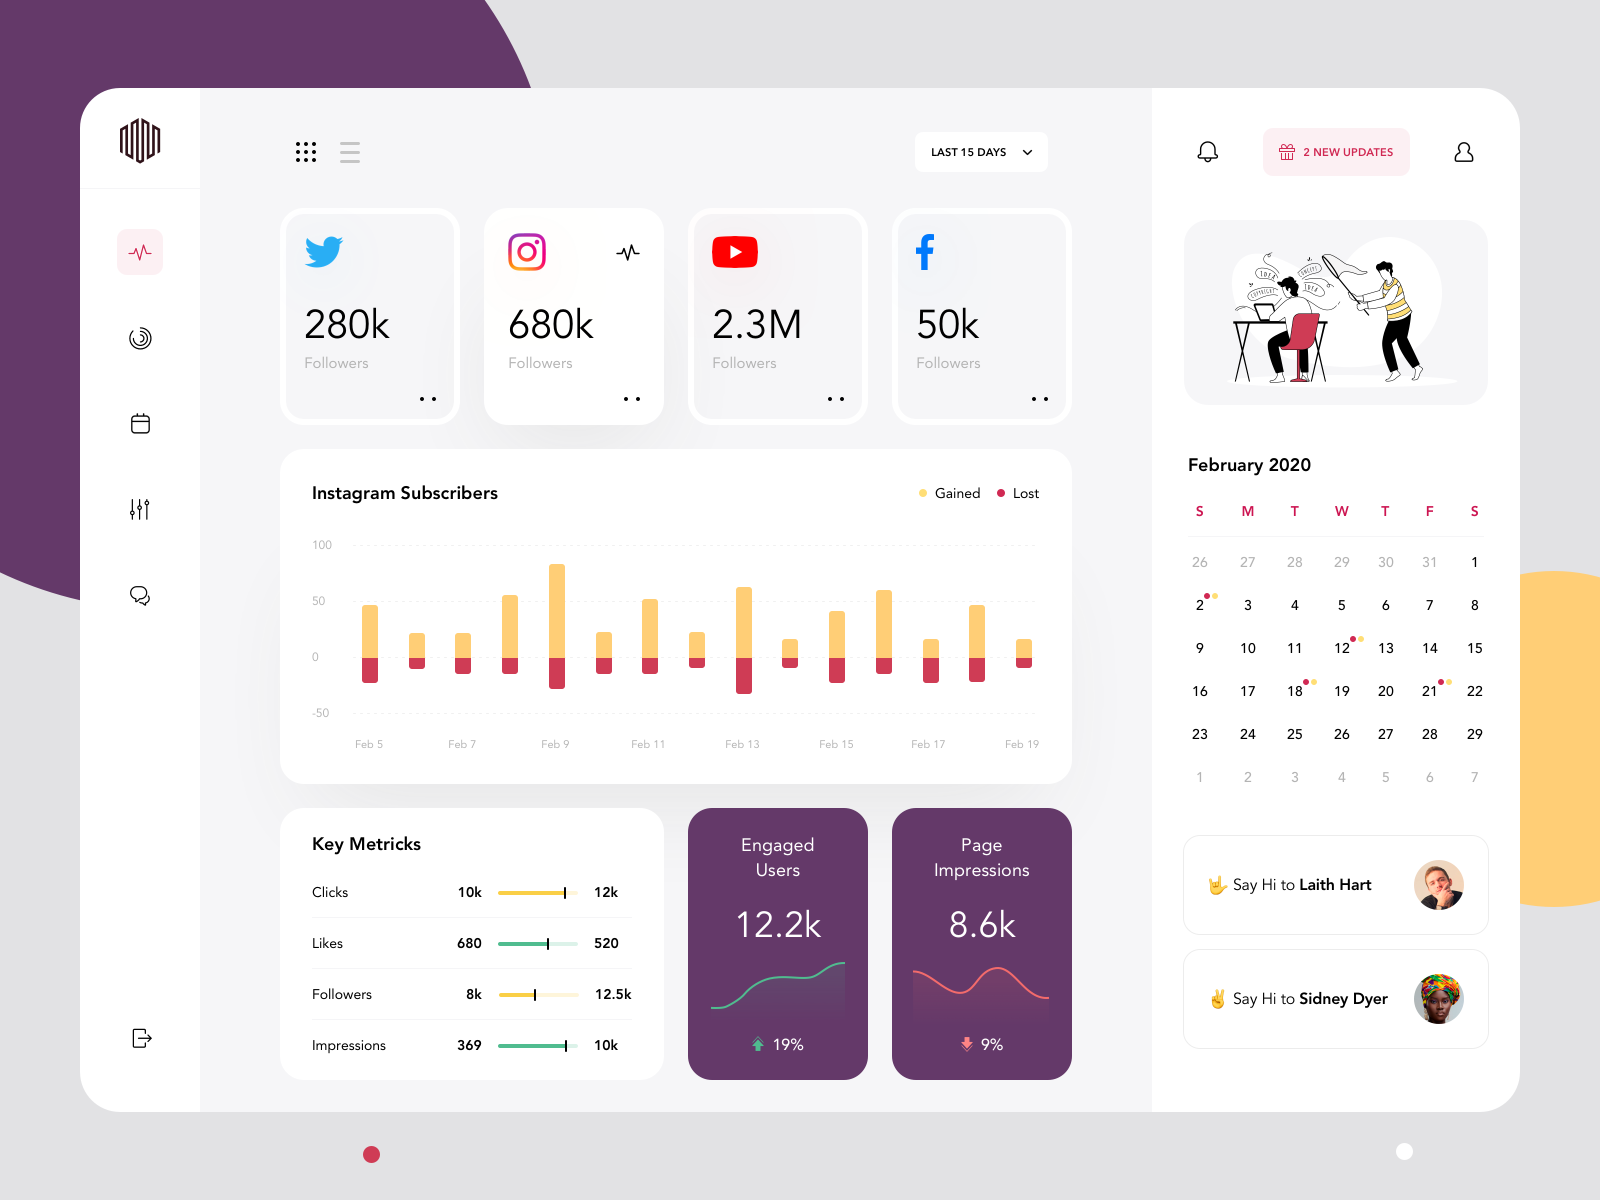
Example of a good social media dashboard, source
Why is it a good social media dashboard?
- Data are easy to read and analyze
- It contains only key metrics that are important to you
- It contains both raw numbers and trends (increase/ decrease presented in percentages)
Just a glimpse and you know how your profiles are doing!
What shouldn’t your social media dashboard look like, then?
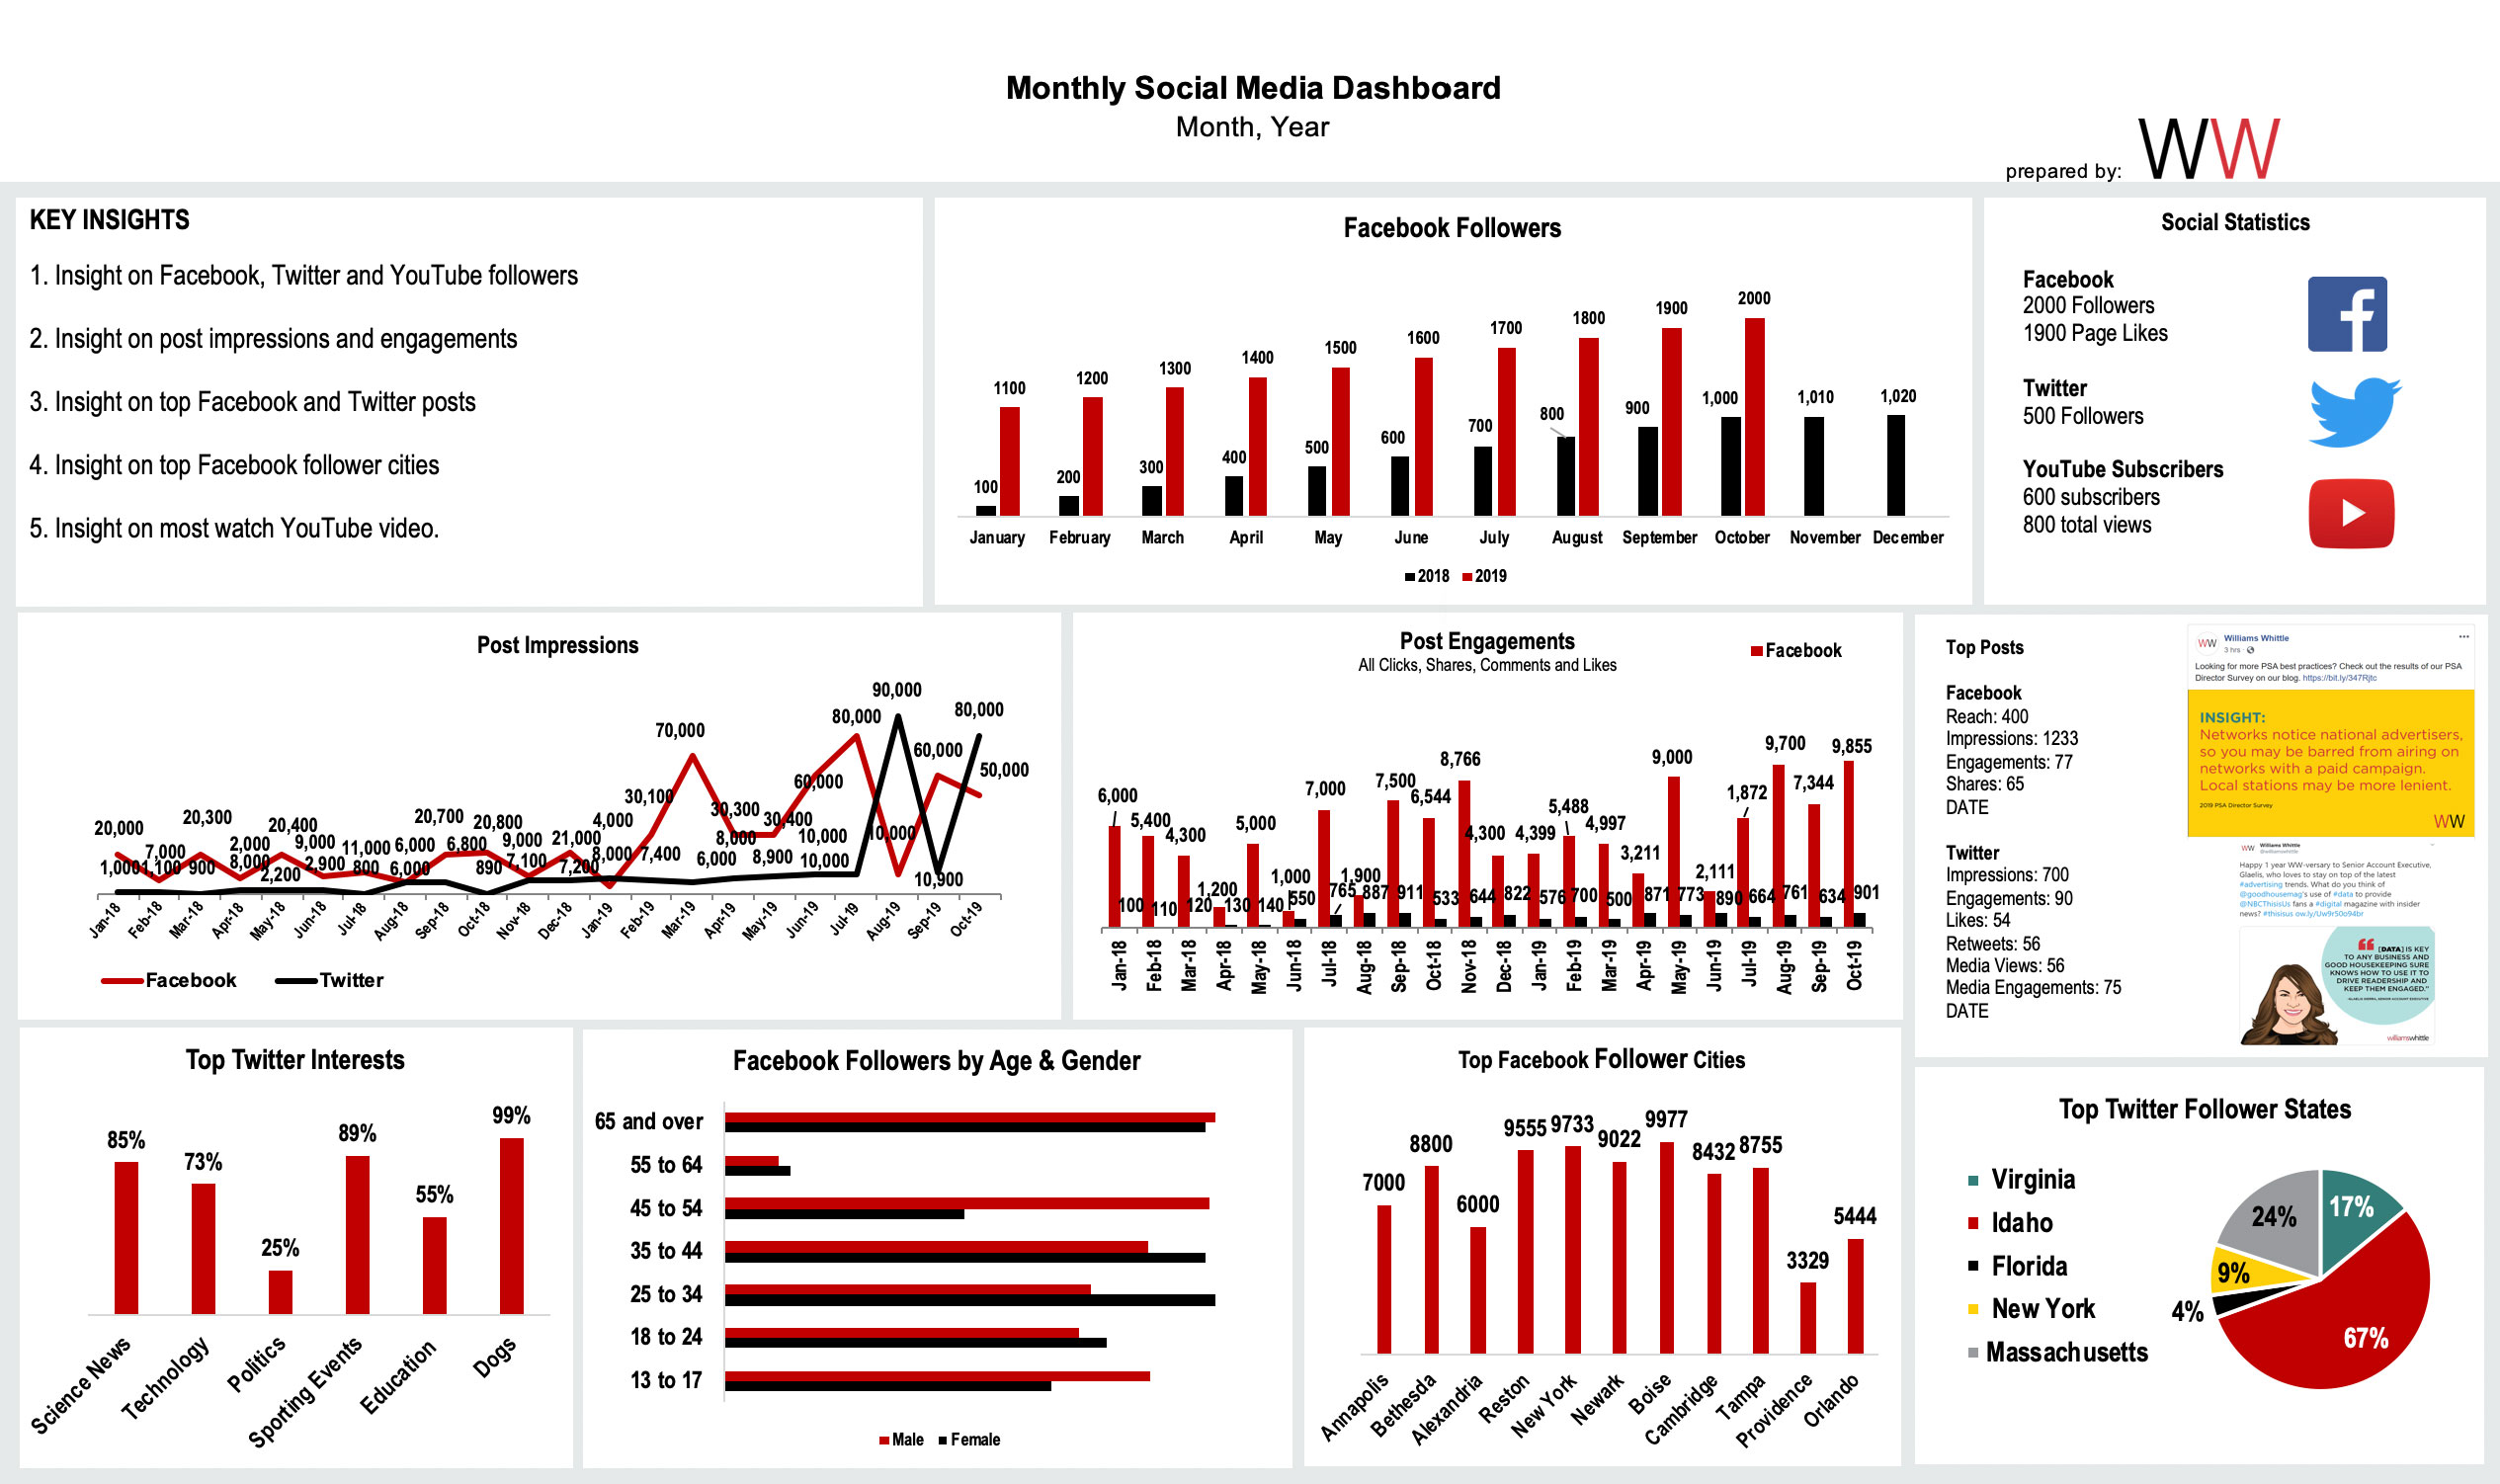
Example of a bad social media dashboard, source
We really feel it’s not the best dashboard you can find out there, because:
- It’s loaded with data
- There’s no clear division between platforms
- Some charts are hard to read (or it’s even impossible to analyze them due to too much data they contain)
- Some data may not be really relevant for a social media dashboard, e.g. top cities (alternatively it will make more sense to show only top 3 cities with the biggest increase in the number of followers)
- Bad UX
This is the moment I understood why marketers are not the biggest fans of data analysis. 😉
Why do you need a social media dashboard?
While social media analytics tools were designed to make your life, and analytical responsibilities, easier, a dashboard is even a step further.
Especially now, in the remote work era, we usually briefly discuss the current performance of our social media channels when we have our daily or weekly standups. A social media dashboard enables the team to quickly access and share key metrics, making collaboration and decision-making more effective. Based on what our analytics suggested the week before, we decide whether any additional actions should be taken. Social media dashboards will provide you with such necessary data just in a minute, instead of having an employee prepare a report by themselves for the whole department to go over.
You’ll benefit from using a social media dashboard in several ways:
- It’ll help you to keep track of your performance on a daily basis: there will be no need to open each social media channel you run separately and dig for data. Just log in to the tool you use and such a dashboard will be most probably the first thing you’ll see.
- You’ll immediately know if there is a need for you to take an action and revise what is going on on a selected profile.
- You’ll be able to compare your profile to competitive ones quickly. It’ll be easier for you to understand your performance and your competitors’ ones by looking at the same metrics.
- As a result of all that, you’ll save time and you’ll be more effective at work.
Key metrics to track in your social media dashboard
When you create a social media dashboard, it’s important to focus on the metrics that truly matter for your brand’s success. Tracking the right key metrics gives you a clear overview of your social media performance and helps you understand what’s working—and what’s not.
Some of the most valuable metrics to include in your social media analytics dashboard are engagement rate, reach, impressions, likes, comments, shares, and followers. Monitoring engagement rate shows how actively your audience is interacting with your content, while reach and impressions help you gauge how far your posts are spreading across social media platforms. Metrics like likes, comments, and shares highlight which posts are resonating with your audience, and tracking follower growth gives you insight into your brand’s expanding reach.
A well-designed social media dashboard makes it easy to track these metrics in real time, so you can quickly spot top-performing content and adjust your strategy as needed. By using a social media analytics dashboard, you’ll get actionable insights into your audience’s behavior, allowing you to make informed decisions that drive better results. Ultimately, tracking these key metrics helps you create more engaging content, grow your audience, and improve your overall social media performance.
Multiple channels integration: managing all your platforms in one place
One of the biggest advantages of using a social media dashboard is the ability to manage all your platforms in one place. Whether you’re running campaigns on Facebook, Twitter, Instagram, LinkedIn, or other channels, a media dashboard lets you track performance metrics across multiple channels without the chaos of switching between accounts.
For social media managers, this integration is a huge time-saver. You can monitor engagement rate, reach, impressions, and other key metrics for each platform from a single dashboard, making it easier to compare results and spot trends. This unified view helps you make smarter decisions about where to focus your efforts and how to optimize your content for each audience.
With a social media dashboard, you get a clear overview of your brand’s online presence across all channels. It simplifies reporting, streamlines your workflow, and ensures you never miss important insights—no matter how many platforms you’re managing. By bringing all your social media data together in one place, you can make your social media strategy more effective and efficient.
Social media dashboard at Sotrender
Most probably you, or the agency you work at, are not managing just one account. The majority of Sotrender’s users are social media managers, who manage several social media profiles at a time.
That’s why at Sotrender we’ve introduced a dashboard that is slightly different from the ones you may know from other tools. We found out that it’s important for our users to see the biggest changes among all the profiles they manage, in a glimpse.
The idea is that there also shouldn’t be many settings available. A dashboard is like a landing page – it should contain only the most crucial information, and be easy to use and navigate.
That’s why when accessing a Sotrender’s dashboard you’ll only have 4 predefined periods of time to analyze data from:
- This week
- This month
- Last week
- Last month
Based on interviews we had with our users, we’ve come up with metrics that are important from a marketers’ perspective. Those metrics may differ slightly depending on which platform you want to analyze.
Under each metric, you will see top 3 profiles, which will be filtered from the ones with the biggest growth (e.g. highest growth in the number of fans) or from the ones with the biggest value.
Apart from the numbers, you’ll also see the changes marked in green (if there’s an increase) or in red (if there’s a decrease).
Depending on a platform, these metrics are:
On a social media dashboard for Facebook:
- Metrics can be organized and analyzed by Facebook pages, allowing you to monitor performance across different pages you manage.
- Highest growth in the number of fans
- Highest Interactivity Index (which is an aggregated engagement metric)
- Highest PTAT
- Highest number of users’ reactions
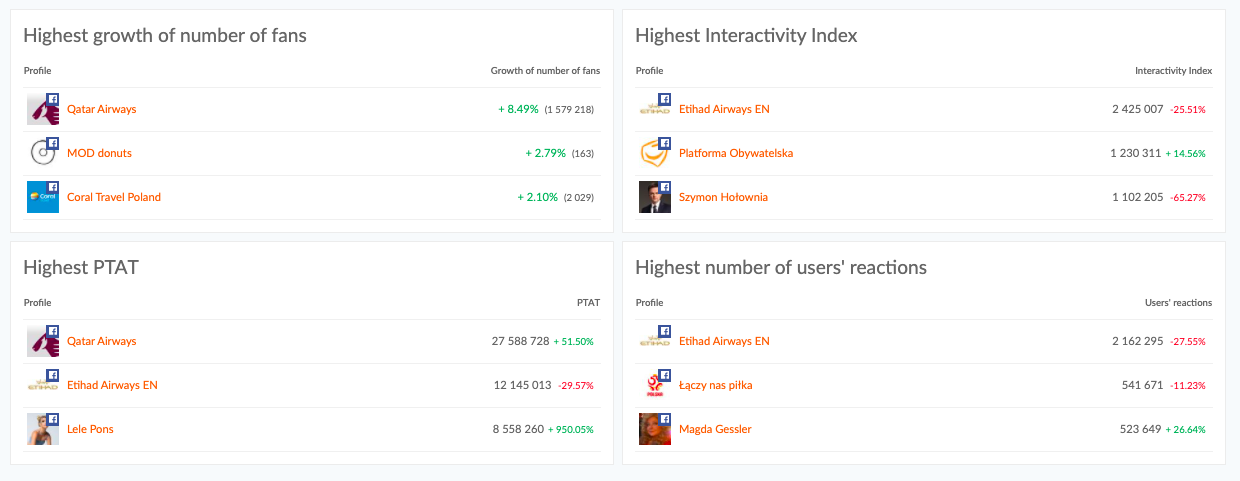
Social media dashboard comparing Facebook profiles at Sotrender
For the selected period of time you’ll also get 3 posts which had the highest engagement. Each post’s performance is tracked and analyzed, helping you optimize your future posting strategies.
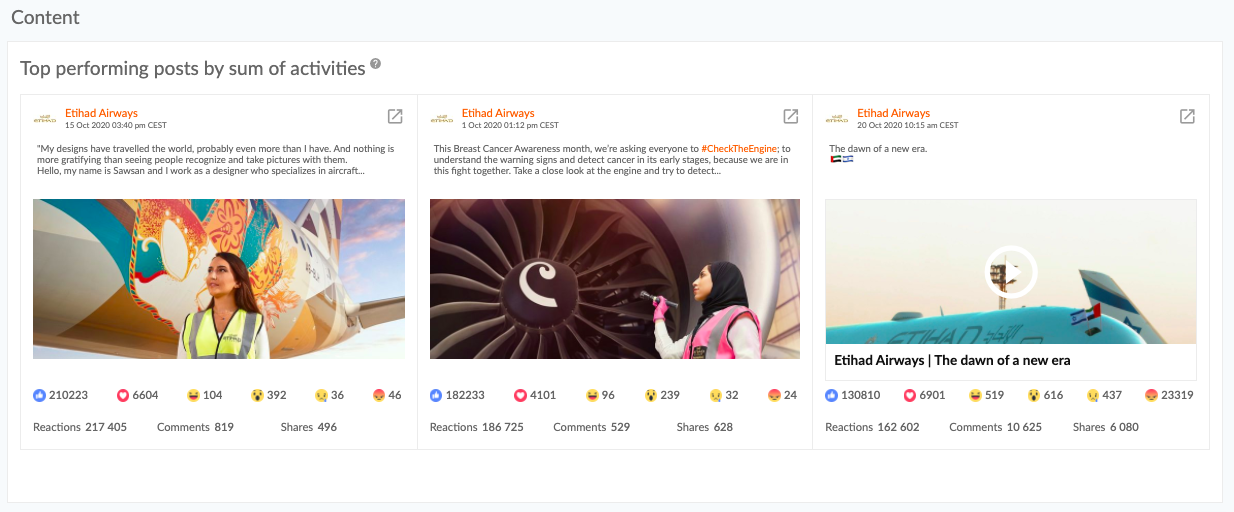
Top posts on a Facebook dashboard, Sotrender
On a social media dashboard for Instagram:
- Highest growth in the number of followers
- Highest average reach
- Highest number of profile views
- Highest number of user activities
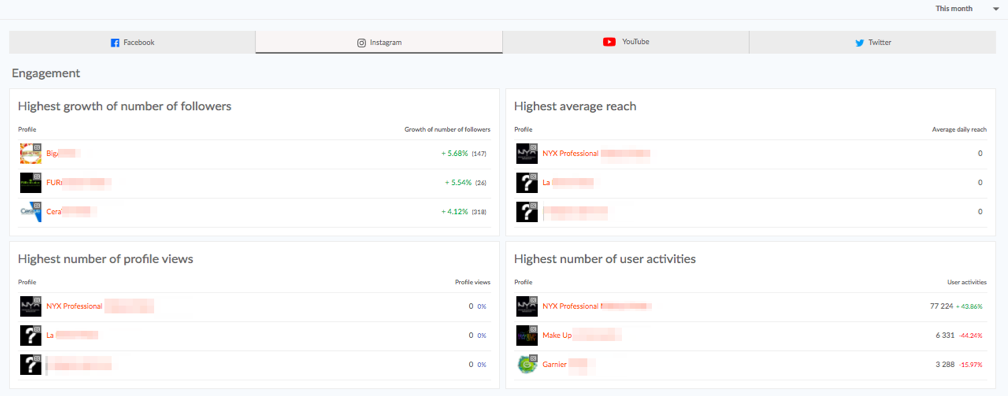
Dashboard presenting Instagram profiles at Sotrender
Respective to other channels, you’ll also see posts that gathered the highest engagement in the selected time period.
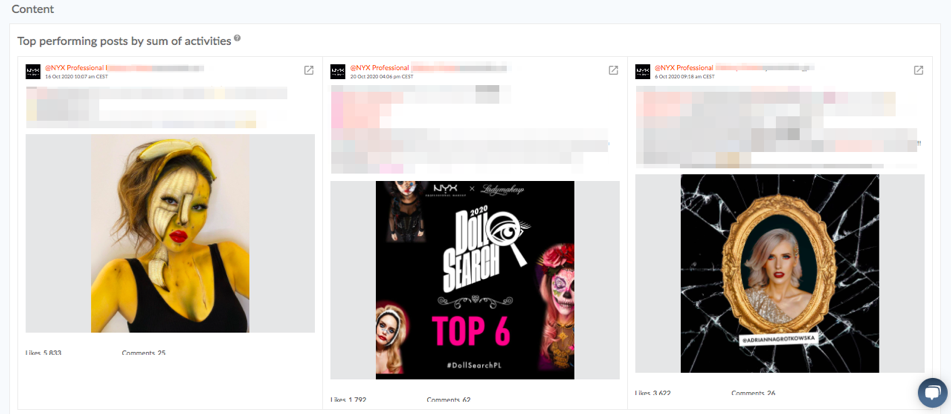
Top posts on an Instagram dashboard at Sotrender
On a social media dashboard for Twitter:
- Highest growth of number of followers (percentage and the total number)
- Highest number of followers (these two may not necessarily show the same: a profile may be very big but the growth in the number of followers may be not really dynamic)
- Highest number of brand activities
- Highest Activity Index (this is an aggregated engagement metric for Twitter)
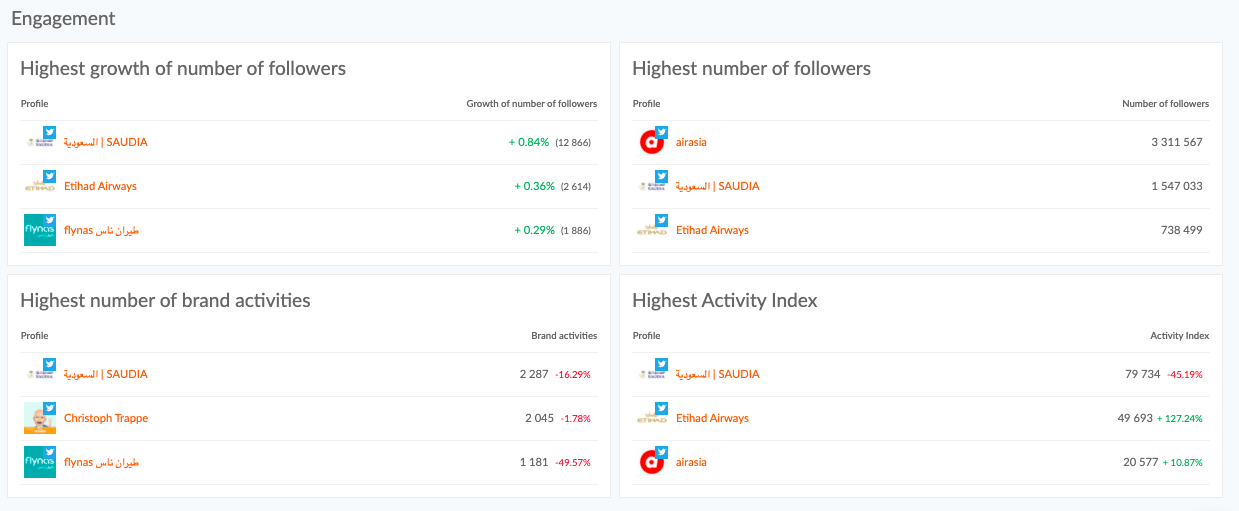
Twitter dashboard at Sotrender
Accordingly for Facebook and Instagram, for Twitter you’ll also see 3 most engaging posts in a selected time period.

Please just note that your dashboard at Sotrender will be created once you have added to your account at least 2 profiles from one channel (for example 2 Facebook profiles or 2 Twitter profiles).
Social media dashboard for tracking ads data
What we’ve covered above was all about organic performance. But currently, the majority of brands are putting a lot of effort into social ads as well. And tracking their performance, effectiveness, and budget spent is even more important.
That means you’ll need another dashboard and the good news is you can find it in Sotrender. Sotrender offers a dedicated performance dashboard for tracking and analyzing the effectiveness of your social media ad campaigns. 🙂
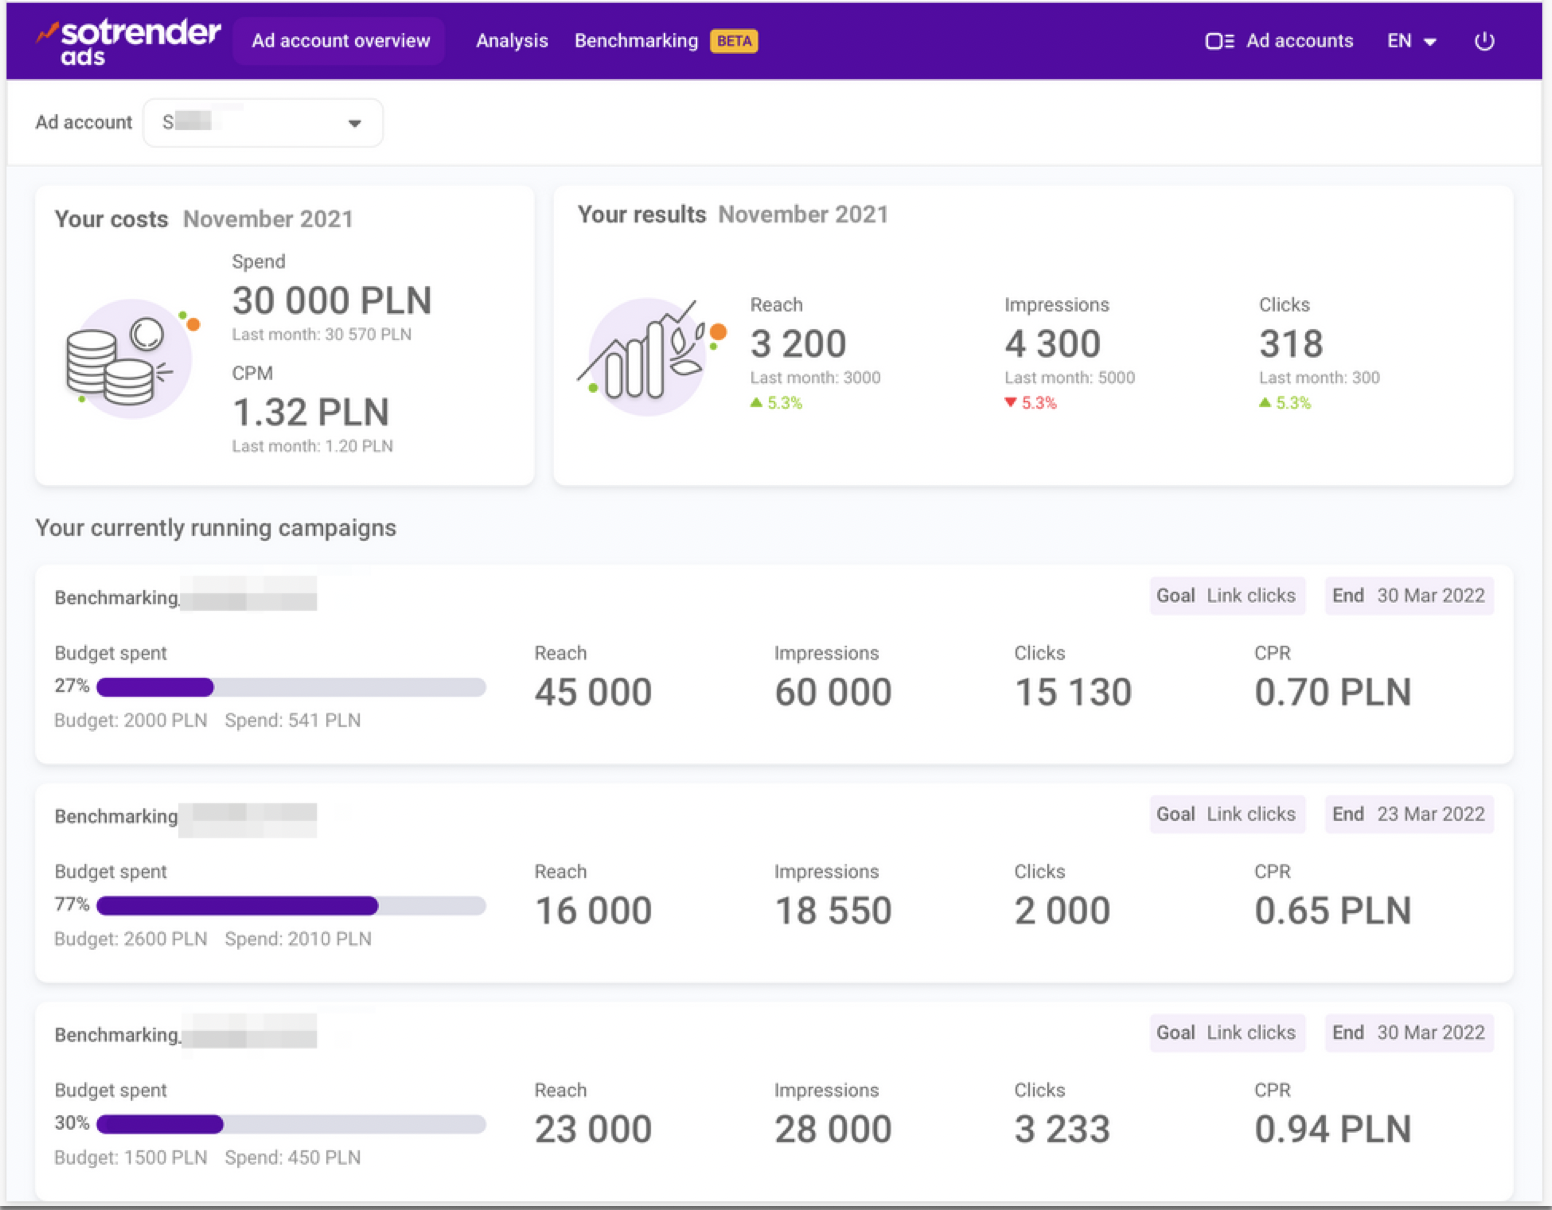
Social media dashboard presenting ads performance, Sotrender
The exemplary dashboard above is quite self-explanatory, huh? 🙂
Such a dashboard is all you need to monitor:
- if you’re getting closer to achieving your goals,
- if you’re not overspending, and if the costs (e.g. CPC or CPM) are on the acceptable level,
- which of the active campaigns are the most effective and could be extended,
- which campaigns are underperforming and should be switched off,
- what are the key results of each campaign, e.g. the total reach or the number of clicks.

Use a comparison dashboard to spy on your competitors
There is also another way to create social media dashboards at Sotrender.
Imagine that you run 5 Instagram profiles: 3 for restaurants, 1 for a beauty brand and 1 for a clothing brand. You’d like to create a dashboard only for the restaurants’ profiles to compare them to each other easily. It doesn’t really make sense to compare a profile of a restaurant with a profile of a clothing brand, right?
You can also do that in Sotrender by using the Comparison feature. With this feature, you can benchmark performance across platforms like Facebook, Instagram, and TikTok to get a comprehensive view of your social media strategy.
This is how such a custom dashboard, in our example for a few airline companies, looks like:
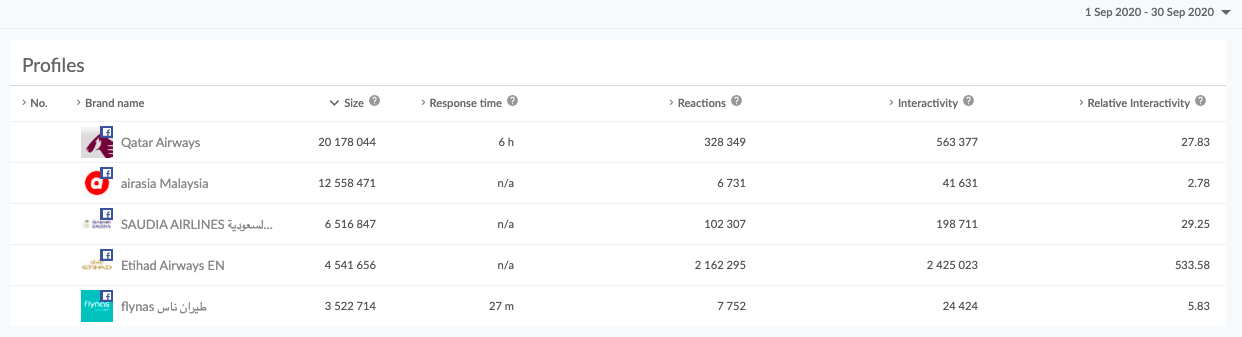
Comparison dashboard for selected Facebook profiles of airline companies
Note that this dashboard contains more in-depth data than the one that we’ve previously talked about.
It’s also more interactive – on a selected chart you can always unclick the profile (or profiles) which you’re not interested in at the moment.
On such a comparison dashboard you’ll also get a few more charts comparing these profiles to each other. Sotrender provides ready-to-use templates for setting up comparison dashboards, making it easy to tailor analytics to your specific needs.
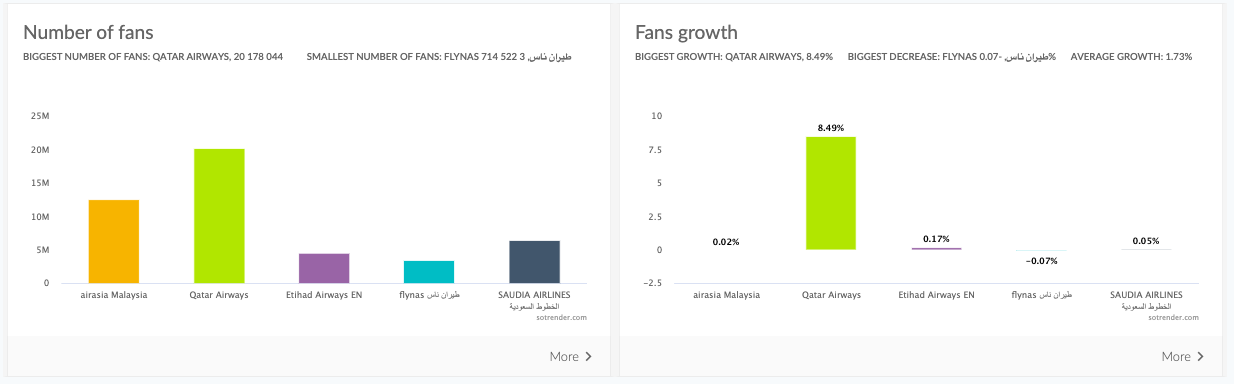
Social media dashboards presenting the number of Facebook fans on selected profiles

Best practices for social media dashboards
To get the most value from your social media dashboard, it’s important to follow a few best practices. Start by customizing your dashboard to focus on the key metrics that matter most to your business—such as engagement rate, reach, and top-performing content. Use real-time data to stay on top of trends and respond quickly to changes in your social media performance.
Leverage the reporting and analytics features of your social media analytics dashboard to generate insights that inform your strategy. Regularly review your dashboard to track progress, identify what’s working, and spot areas for improvement. Don’t be afraid to adjust your dashboard as your business needs evolve—flexibility is key to making the most of your data.
By creating a social media dashboard tailored to your goals, you’ll be able to track performance, optimize your content, and drive better results across all your platforms. Remember, the best dashboards are easy to use, provide actionable insights, and help you make data-driven decisions that boost your social media performance. With the right approach, your social media dashboard will become an essential tool for growing your brand and achieving your business objectives.
An urgent need for more data?
Social media is sometimes unpredictable, and the same goes for your day at work.
We all know that sometimes an unplanned meeting can come up and what your social media dashboard provides won’t be enough at a time.
What now?
If you are a user of , you can generate a PDF report anytime (actually such a report can come in some other formats as well, but our customers usually go for PDFs). These reports are an essential part of social media reporting, helping you communicate key insights to your team or customer quickly and efficiently. Reports can also be tailored to meet the needs of different customers, ensuring that each customer receives the most relevant data for their business objectives. In a minute’s notice (literally), you will have a full set of data presenting the performance of a selected social media profile ready.
Just take a look at how easy it is!
Conclusion
Obviously one can live without a social media dashboard, as we can all survive without visiting McDonald’s. 😉 But we should be making our lives easier and more pleasant, also at work, and having access to a social media dashboard is a perfect example of that.
What are your thoughts about that? Do you think that a social media dashboard is a must in a marketer’s daily routine? Or maybe you’ve already used some and you know what such a dashboard should or shouldn’t look like?


