
We often get questions about the indicators or definitions that we use in Sotrender on a daily basis – internally and externally in blog posts and in clients’ reports. We know that although some things may be obvious to us since we’re used to them, it’s not the same for everyone. This is why we’ve created the Sotrender Glossary!
Find all the definitions, explanations, and clarifications you need below.
A B C D E F G H I J K L M N O P R S T U V W X Y Z

ABO
Ad Set Budget Optimization – when setting a campaign budget, you can choose between a daily budget or a lifetime budget. Depending on the selected option and campaign duration, you can test different bidding strategies.
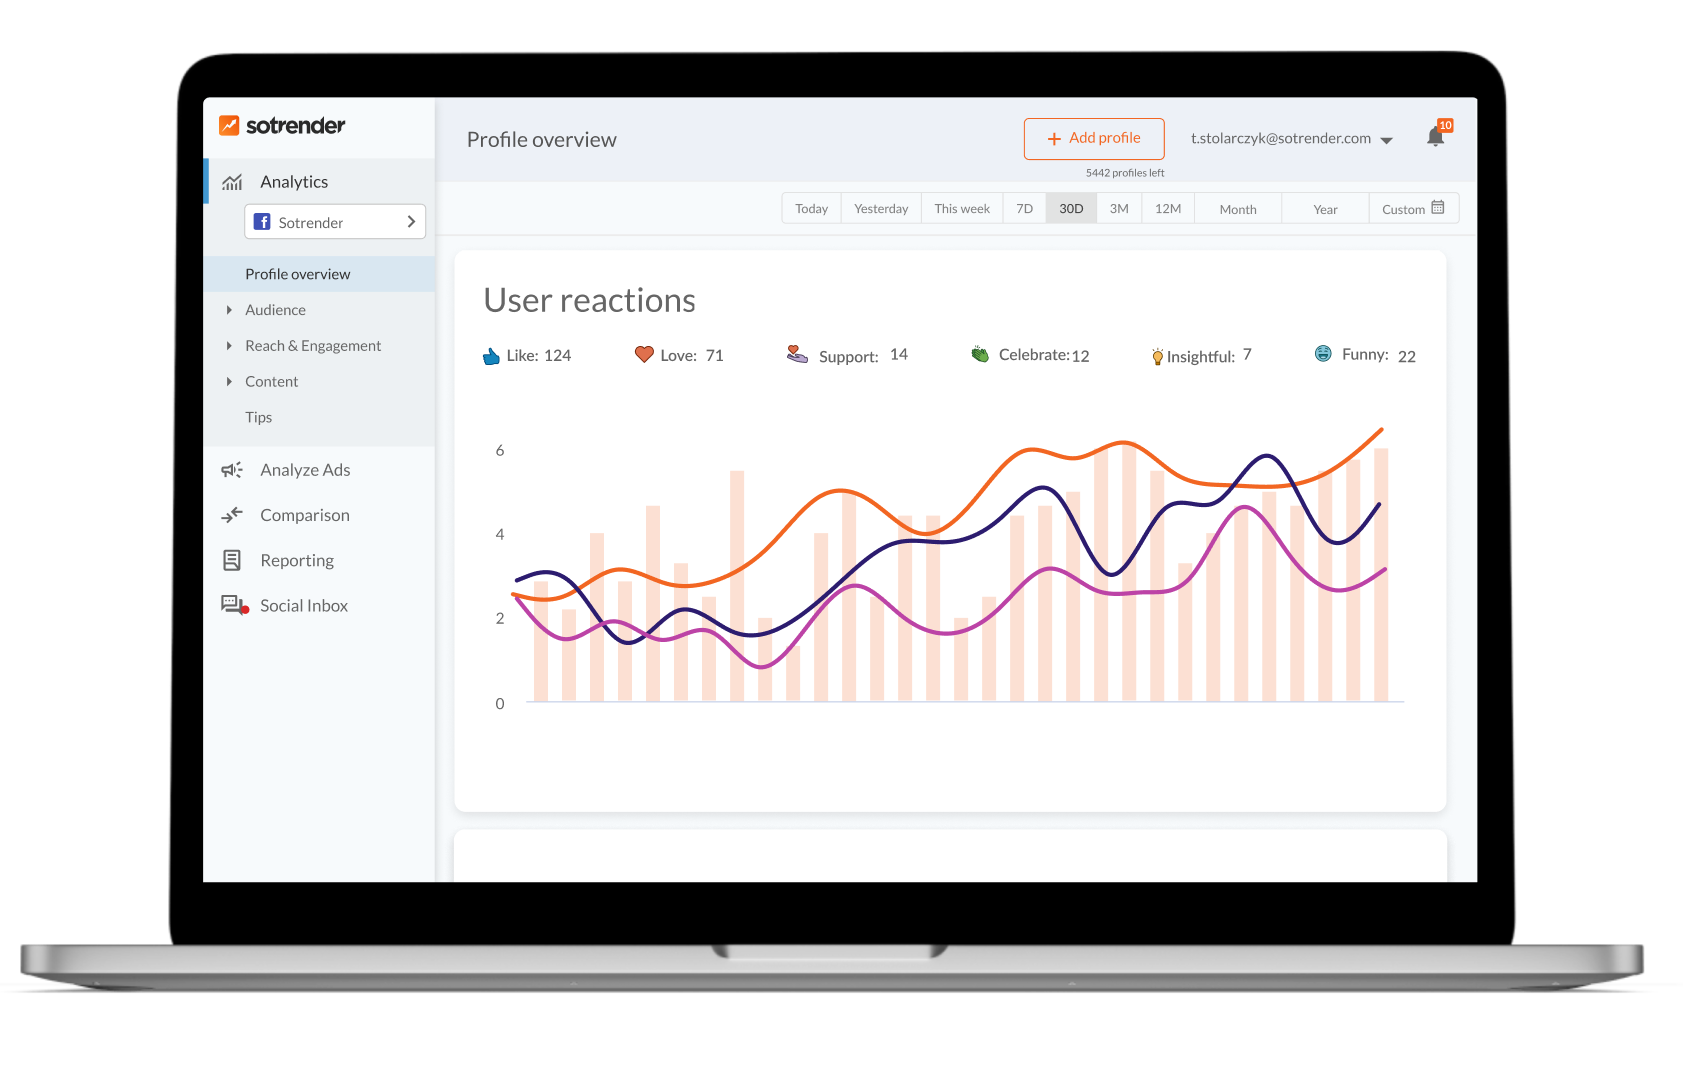
Active Users
Active users who have interacted with the profile within a period of time. This includes liking, commenting, sharing/retweeting content, or posting on a profile for example.
You can check the number of users involved and the percentage involved for any day or hour. Additionally, you can take a look at the change over a longer period of time.
You will find out more about active users from the Community Ranking chart.
Active Followers
Active followers is a metric that shows when (on which days and at what times) your Instagram followers are actually active on your profile. Posting during peak activity periods can help you reach your audience more effectively.
In Sotrender, the Online followers chart can be found under Analytics → Reach & Engagement.
Activity Index
This is a metric used to measure activity on TikTok, Instagram and LinkedIn. It is the equivalent of the Interactivity Index on Facebook. It summarizes all of this activity by aggregating it in one measure. Here’s how it looks for the two platforms.
Activity Index Measurement System:
For Instagram:
- Like -> 1
- Comment -> 8
For LinkedIn:
- Reaction -> 1
- Comment -> 4
- Share -> 16
For TikTok:
- Like -> 1
- Comment -> 20
- Try it free for 7 days
- Explore all features
- Track your competitors' results
Ad
The final step in the campaign setup process on Facebook or Instagram is creating the actual ad. This includes the visual (image or video), the ad copy, and a call to action (CTA). A single ad set can contain several ads with different creatives. It’s always a good idea to test multiple variants to see which performs best.
Ad Benchmarking
Ad benchmarking is the process of analyzing and comparing ads and their results across advertisers.
In Sotrender, there’s a dedicated module where you can see how your ad performance compares to others in your industry.
In the Analyze Ads→ Benchmarking section in Sotrender Ads, you can check:
- Your CPM Score, which shows whether your average CPM in the last month is higher or lower than your competitors’
- CPC Score, which shows how your average CPC compares to your industry
- Click Score – shows your total number of ad clicks in the last month and how it compares to similar advertisers
- Impression Score – shows how your total ad impressions in the last month compare to the competition
Sotrender’s Benchmarking also lets you see the median ad spend of your competitors, broken down by campaign objective.
Ad Demographics
When running ad campaigns in the Meta ecosystem, you can analyze who actually saw your ads. You can monitor the demographics of your audience, including age and gender.
Even if you define a specific age group in your ad targeting, the final demographics may differ.
In Sotrender Ads, you can check not only the reach demographics, but also those for engagement, clicks, and conversions.
Ad Set
In the Meta campaign setup process, the ad set is the second stage – and arguably the most important one. Here you define the budget, schedule, and detailed targeting: who you want to reach. Targeting options include location, gender, age, interests, life events, job titles, and more. One campaign can include multiple ad sets, and one ad set can contain multiple ads.
Ad Optimization
This is the process of increasing the effectiveness of your ad in social media.
Ad optimization can occur on several levels:
- At the creative level
- At the budget level
- At the targeting level (e.g., audience interests)
- At the ad copy level
- At the CTA level
Since there are so many possible optimization methods – and thousands of targeting combinations – it’s worth using external tools that support and streamline the process.
One such solution is Ad Optimization in Sotrender, which uses proprietary AI models to recommend new ad settings that can improve performance (e.g., lower CPC or CPM).
Learn more about Ad Optimization in Sotrender >>>
API (Application Programming Interface)
The Application Programming Interface, to put it simply, is a specific bridge between the data source and the application/panel that they want to use.
Sotrender is connected with Facebook, Instagram, Twitter, and YouTube through their respective APIs. Using this, we are able to retrieve specific information then process it and display it in a new form.
We also have our own API at Sotrender which is possible to subscribe to for companies to use the information we provide in Sotrender for their own purposes and further analysis.
Audience Share in Target Group
When running ad campaigns on Facebook or Instagram, it’s important to know whether you’ve actually reached your intended audience. Sotrender lets you analyze the share of audience reached within your selected target group.
By analyzing an ad set in Sotrender Ads, you can see what percentage of your chosen target group your campaign actually reached.
Authorization
This is for controlling access to your Page information. It is particularly important because it allows the application to provide you with detailed information about the managed Page (and also makes the process much more accurate and faster). Authorization allows for “insights” such as reach, demography, negative feedback, or sources of likes that can be viewed directly on our platform.

Benchmarking
This is the process of comparing one company, product, brand, or operating strategy with others to find better and more effective solutions. This analysis can be done against both direct competitors or other local companies as well as market leaders or more general standards for example.
Benchmarking informs you not only where in the market the company stands but which activities specifically are effective and which are less effective. It also allows you to keep track of current trends or how to stand out from the competition.
Benchmarking works well where two or more social media profiles/channels and can be analyzed and compared. What is very useful in this respect is Sotrender’s Comparison function where you can create a group on any platform to create reports about these profiles.

Campaign
In the Meta ecosystem, an ad campaign consists of three elements: the campaign, ad set, and ad. At the campaign level, you set the overall objective and can also define the total budget.
Campaign Objective
The campaign objective is one of the key settings in the campaign. It defines what you want to achieve with the campaign and which users your ad should reach. The algorithm will target different users depending on whether you choose an awareness, engagement, or sales objective – based on user behavior in the Meta ecosystem.
The objective is selected during the first stage of campaign setup (Campaign level).
Community Ranking
This is a list/ranking of users who have had any interaction with a profile in a given month.
The ranking is based on the interaction with the Page and the content posted based on the Interactivity Index (InI). It also includes segments about the type of interaction performed (people who like, comment, discuss, and so on). You will be able to see the days in which the user was mostly active.
Community ranking is a monthly ranking – you can check the values only for a full month; which results in larger amounts of data being looked at for improved accuracy.
Sotrender does not store information relating to users’ names.
CPC
Cost per Click – the price you pay for one click in your ad campaign. One of the key billing metrics in advertising systems. Marketers usually aim to lower this metric, and Sotrender’s Ad Optimization can help with that.
CPM
Cost per Mille – the cost of 1,000 ad impressions. The average CPM can vary depending on the campaign type and objective, as well as the industry you’re in.
CPR
Cost per Result – a metric that shows the cost incurred to achieve a specific result in your marketing campaign (e.g. in the Meta ecosystem).
CX Score
CX Score is our proprietary metric used to measure the quality of customer service on Facebook.
It is an aggregated metric measuring the quality of moderation and customer service activities, based on three variables:
- response speed (time),
- share of replies to customer inquiries in Facebook comments,
- response potential, i.e. the number of comments on the profile compared to a representative sample of Facebook pages.
CX Score is a percentile metric that can range from 0 to 100, where 100 indicates the best possible customer service quality.
For example, a CX Score of 90 means that the page performs better than 90% of Facebook pages in terms of customer service.
We use the CX Score, among others, in our custom reports.

Dark Posts (Unpublished Page Posts)
These are posts that don’t appear on the timelines of Pages on Facebook. Dark posts, formerly called unpublished Page posts, are used to create ads and most often appear to users in their newsfeeds or the right columns on Facebook when the promotion of such posts is active.
Because they’re exclusively commercial, dark posts show only paid reach.

Engagement
User engagement is one of the most important indicators for evaluating the quality of a brand’s communication strategy on social media. Engagement describes how brands are able to incite users’ responses. Through this, brands not only keep on engaging their fans but also their image on the web.
Engagement Rate (ER)
Engagement Rate is a metric that measures engagement. It is calculated as the total number of all activities divided by the number of followers, multiplied by 100.
The metric can be calculated for the entire page (profile) or a single piece of content.
In Sotrender, you’ll find it in the Analytics → Reach & Engagement section.

The Facebook Algorithm (Formerly Edge Rank)
The Facebook algorithm is responsible for displaying the content on the users’ feeds, evaluating whether it would be interesting for the user. This algorithm affects the reach of every post.
Many factors matter when it comes to the algorithm. Some of the most important variables are Affinity – the person with the given Page, the weight of the post which is calculated using the number of activities performed on it, and time decay which is affected by the time since the publication of the post.
Facebook Insights
These are Facebook statistics that give Page administrators in-depth information about their Pages. They can help track user behavior with published posts, find answers to questions such as “when is the best time of the week/day to post?” and “what kinds of posts are my most popular?”. This can help increase the efficiency and interaction of posts with the user base.
Frequency
Frequency is the average number of times an ad has been displayed on the feed of a user. It is counted as the number of impressions divided by the total reach.
When setting up Facebook ads, you can determine how many times a given ad is shown to a user which would of course be dependent on the budget of the campaign.

Interactivity Index (InI)
This is a Facebook activity indicator (created by Sotrender). InI calculates the individual activities and assigns them the appropriate weights according to their relevance to the Page. This allows the InI to help identify which content was the most engaging, considering the importance of individual activities. The metric can be calculated from the brand’s perspective or that of the user’s.
- Likes = 1
- Comment = 4
- Post (text, status or multimedia, etc.) = 12
- Shares = 16

Median
This is a very short description of the middle value of a given dataset. In many cases, in the quantitative studies conducted by Sotrender, the use of the median is more justified than the use of the average since it’s more resistant to extreme values in a given dataset.

People Talking About This (PTAT)/Storytellers
People Talking About This shows a wide range of users around the Page. It takes into account people who have liked the site, posted on the Page, reacted to posts, commented, or shared as well as responding to event invitations as well as a few other actions.
PTAT is the only metric that, without access to insight data, assesses the impact of advertising activities. This is because this includes Dark Posts which is content that only appears to users to whom it was targeting.

Organic Reach
This is the number of pageviews and its content with no additional promotional activities.
Paid Reach
This is the number of page impressions and its content that are the result of paid promotional activities (ads).
Reach Score
Reach Score is Sotrender’s proprietary metric for evaluating ad reach for a brand in a given month.
For example, a Reach Score of 90 means that the ads on that profile reached 90% of the audience size reached by the best-performing profile that month.
We use Reach Score in our Ad Trends report and in custom reports.
Recurring Reports
Recurring reports are a type of report available in the Sotrender app. You only need to set them up once (for a chosen channel and time period), and they will be automatically generated and sent to a specified email address – no manual effort needed each time.
ExampleOne of the most popular use cases is monthly reports. Once you set the reporting period and channel, you’ll receive a ready-made report in your inbox on the selected day – e.g. the first day of each month – with a summary of the previous month’s results.
Relative Interactivity Index
This is an index created on the basis of the Interactivity Index but it takes the size of the Page into account. Therefore, it allows you to get a more accurate comparison of different Pages.
Relative interactivity index = (InI/# of fans) * 100
Response Rate
A metric indicating how often a page responds to users’ posts within a certain time period and shown in % points as well. The response rate doesn’t include measurements of responses to users’ comments but only to posts.
Total Reach
Reach is the number of page views and content views in a given time period regardless of whether the person saw the content or interacted with it.
This includes both paid and organic reach.
Viral Reach
This is the number of pageviews and their content that are the result of other users’ activities. Viral reach information is available only from the Sotrender panel and not in Facebook statistics tools.

Scores
Scores are proprietary metrics available in the Sotrender app and in custom reports.
The most frequently analyzed and popular Scores include:
- Reach Score – ad reach metric
- CX Score – customer service quality on Facebook
- CPM Score (in Sotrender Ads)
- CPC Score (in Sotrender Ads)
- Impression Score (in Sotrender Ads)
- Click Score (in Sotrender Ads)
By using Benchmarking in Sotrender, you can also check, among other things, the median ad spend of your competitors broken down by specific campaign objectives.
Sotrender Ads
Sotrender Ads is one of the modules in the Sotrender app, where you can analyze your ad performance, generate reports, and compare results with your competition. The newest feature available in Sotrender Ads is Ad Optimization – powered by our proprietary AI algorithms. It helps improve your ad performance by recommending settings that can reduce your CPC or CPM.

Target Group/Target Audience
These are people or entities (such as companies or institutions) who, because of certain characteristics/preferences, are potential customers of the company/brand. These are the people to whom marketing and sales activities will be targeted.
Getting to know your target audience is a constant process because as people’s preferences change, the messages that are addressed to them must also be changed.
One way to better understand the target audience is to conduct an Audience Scan.
Trends Reports
Trends reports are the largest monthly and free publications summarizing the results of UK pages and channels on Facebook and Twitter. The reports include in-depth demographics, reach, fan engagement, activity statistics. Currently, they cover less than 80 Facebook thematic categories and around 40 for the remaining platforms. The latest editions of the reports can be found on our website under the Reports tab. Trends reports for the UK have been discontinued since August 2017.

Total Views
Total views indicate the overall number of times a piece of content (or a Page/profile) was viewed within a given time period, regardless of whether the views were paid, organic, or viral.
Viral Views
Viral views are impressions generated as a result of user interactions with a piece of content, allowing it to reach new audiences. These are not impressions supported by paid efforts (advertising). Viral views are influenced by factors such as shares and comments. Viral content refers to posts where a significant portion of views come from viral reach.
Congratulations! You’ve just made it to the end of our glossary! Are there any other terms that you’re not familiar with? Let us know and we’ll add it there!


