It is widely known that boredom is not our cup of tea. We are still seeking new solutions that make marketers’ and analytics’ everyday work better and easier. One of them is Relative / Absolute Affinity – an interesting novelty that a lot of our Clients asked us about. After some trial periods we decided to apply it to all profiles. In this blog post, we are going to tell you a bit more about this feature.
What is Affinity index?
Thanks to it, you’re able to compare your profiles to tens of thousands of others in our database – not only to those you keep an eye on in Sotrender. Charts will show you the number of engaged users (unique users who made one of the following activities on your page: like, share, post or comment) in referrence to other profiles and industries. This chart you’ll find in the “Audience” section.

To understand charts properly, it’s worth finding out some differences between absolute and relative affinity.
What is an absolute affinity?
It’s coactivitity shown in a number of the same coengaged users on analysed profiles.
Take a look at this example:

If the value of absolute affinity or our profile and for Coca-Cola profile stands at 168, it means that those two profiles have 168 engaged people in common. These same people are active on our profile and on Coca-Cola’s profile.
Our profile and the Axis one have 156 engaged users in common.
What is relative affinity?
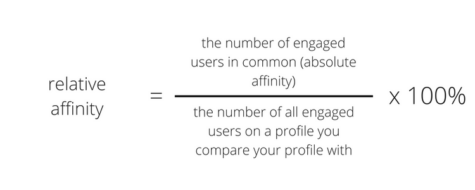
Relative affinity index is reflected in percentage:
In previous example our selected profile and the Coca-Cola profile have a relative affinity index of 0,01%, meaning that 0,01% of all engaged users on the Coca-Cola profile are engaged on our profile as well.
In Sotrender you will find users’ coactivities divided into two sections: profiles and industries
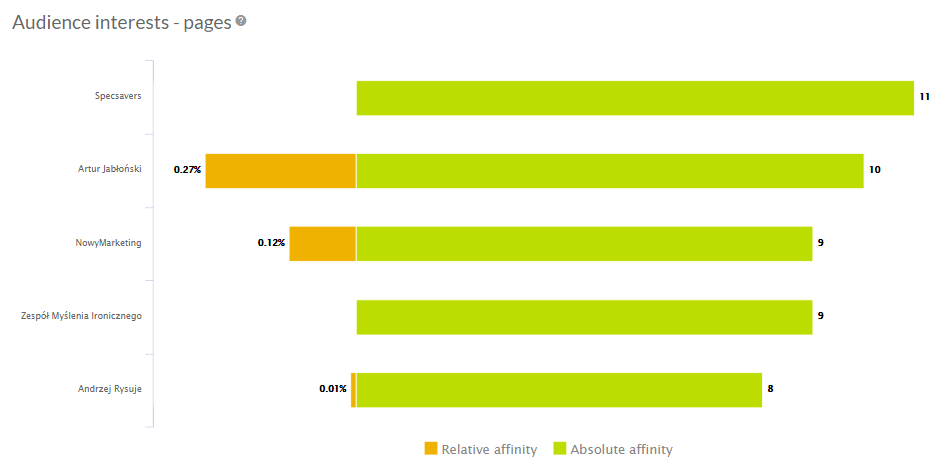
Audience Interests – Pages
Thanks to our new chart you’ll see with which five profiles from our entire database your profile has the biggest number of engaged users in common.

Do 5 profiles only whet your appetite to find out a bit more about your target group? We offer some special reports that will reveal every marketing secret.
Audience interests – Industries
This wider coactivity research shows how many engaged users of your profile are engaged in a communication of profiles from different industries.

For industries we only use absolute affinity index.
How to interprete affinity index?
Coactivity charts can be helpful for marketers and agencies at:
- benchmarking,
- setting up and optimizing your marketing strategy,
- choosing a type of content,
- new ways of reaching your target groups,
- being a source of inspiration.
When the index is particularly high, it can mean that you should keep an eye on selected profiles. They may have a similar communication, engage similar target groups and be a great way to get inspired. There are some industries and profiles where Coactivity index can vary from 30 to 40% – ignoring this kind of data may bring about missing out some good marketing opportunities.
If 5 profiles or categories are not enough for you, contact us – we’ll find a perfect solution for you and your brand.
We hope that our new feature will win your hearts – if you have any queries or comments, give us a shout at support@sotrender.com


