As you may (or even should) know, we’ve shut down old Sotrender for good. We’ve been focusing all our efforts into making the app the best version it can possibly be. It’s more comfortable, effective, and easier now than ever before. In the latest update, we refurbished the menu and navigation, introduced some new metrics, and modified report creation.
(This text was updated in May of 2020)
Brand new menu
Based on feedback from our clients and observations of user behavior, we decided to completely change the menu and navigation in the tool.
From now on, the sidebar menu consists of 7 sections. Charts that were previously in the ‘Optimization’ section have been moved to more specific areas, and automated tips now have their own section. We know you use them a lot, so we decided to make them as easy to find as possible.
New reporting in Sotrender
The ‘Reporting’ section is now completely different. You won’t find any charts here like you used to (we moved them to their corresponding sections – ‘Reach and Engagement’, ‘Audience’ and ‘Content’).
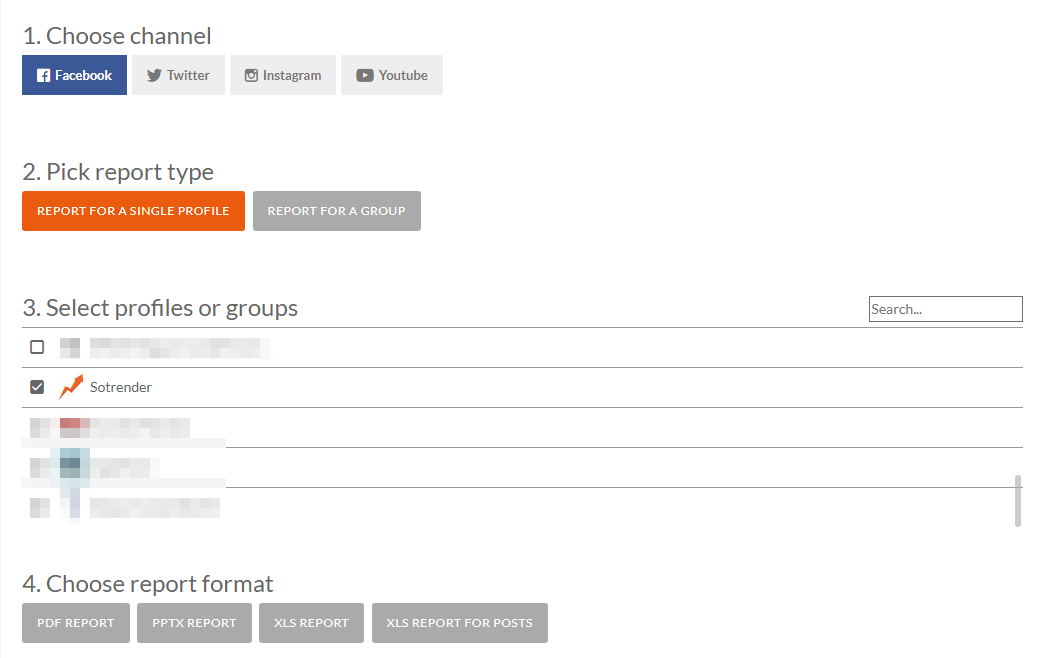
New reporting in Sotrender
When creating a report, you can now prepare the document exactly how you want and need it to be – for one profile or for a group of profiles (no need to go to the ‘Comparison’ section anymore). And you know what is even better? You can now add up to 14 profiles to your group!
Additionally, you can now prepare several reports all at once. That’s even more time saved when reporting for clients!
New metrics
Another new feature in Sotrender is adding PTAT (People Talking About It or Storytellers) for any given Facebook Page. You’ll find this chart in the ‘Reach and Engagement’ section.
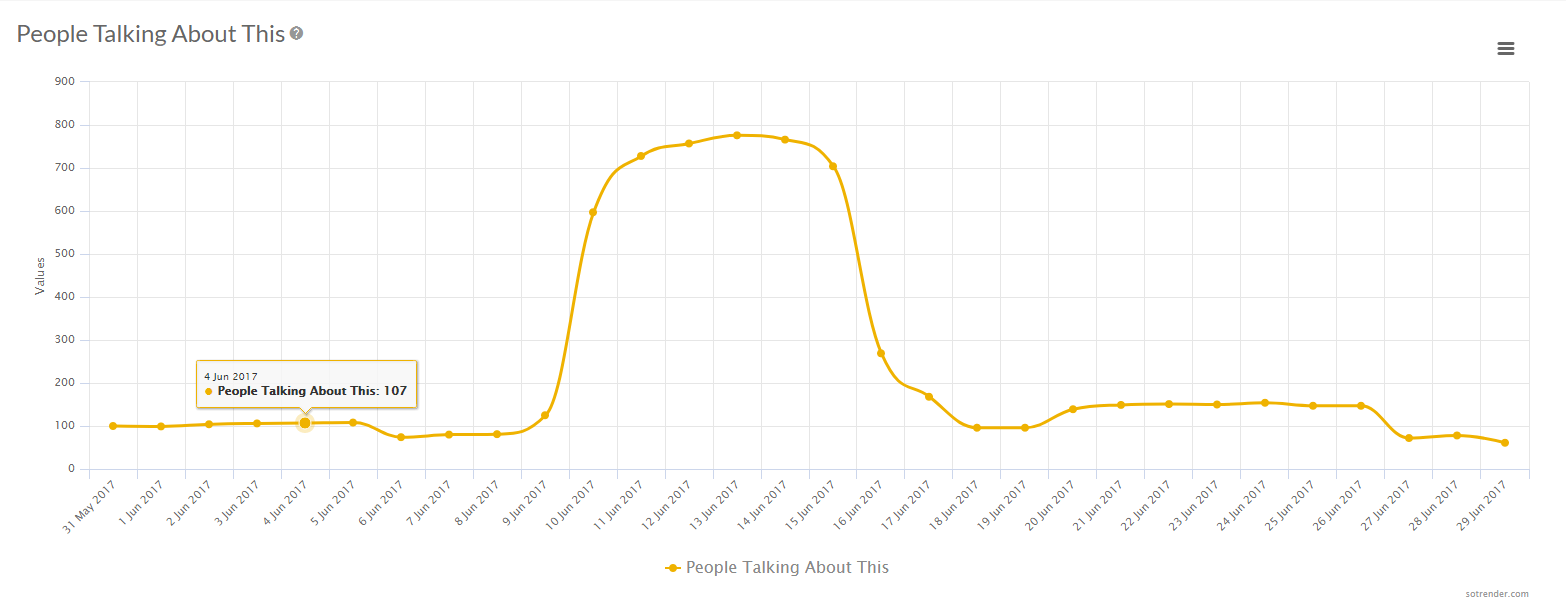
People talking about it chart in Sotrender
PTAT is the only metric that, without access to insights data, offers some estimates into the influence of paid communication (that’s why we also included it in Facebook Trends), including so-called dark posts (posts that don’t appear on a Page’s Timeline, only in user Newsfeeds). Soon we’ll share a more detailed discussion on this subject.


